


Geoff Yu at BNY argues that the lack of further Fed tightening has eased global financial conditions and partially offset European Central Bank (ECB) tightening, but European inflation dynamics remain distinct from the U.S. The report favors received positions in European rates, while warning that rising services PMIs, elevated input costs and margin pressure could undermine a sustainable demand recovery and pose stagflation risks for the Euro area.
European PMIs and rate positioning
"The lack of additional tightening by the Fed has led to hopes of easier financial conditions globally and helped offset some ECB tightening through the external channel. Falling prices for dollar-priced commodities will generate some negative pass-through on the margins, but until there is clear visibility over the conflict, rates markets are unlikely to remove the near 45bp currently priced in additional tightening by year end."
"As long as this balance holds, we favor adding to received positions in European rates, which will also help alleviate financial conditions on the margins. We stress that the European inflation situation remains fundamentally different from that of the U.S., where there is a stronger demand case, led by investment growth."
"Based on the Eurozone PMI details, the fundamentals behind services recovery don’t bode well for a sustainable demand lift. Softer headline prices have helped with the recovery, but the effect of price changes is overstated."
"Even as the ceasefire was implemented, Services PMI input prices remained at their highest levels since early 2024. The spread between input and charged prices is now at its widest in nearly three years, pointing to significant margin pressure across the sector."
"For a country with the worst real rates in emerging markets, by some distance, the outlook for the currency will deteriorate further."
(This article was created with the help of an Artificial Intelligence tool and reviewed by an editor. Know more.)

- GBP/USD eases to the 1.3450 area from seven-week highs just above 1.3500.
- The downwardly revised UK S&P Global Manufacturing PMI has added negative pressure on the Pound
- Experts at BBH foresee a dovish repricing of BoE's monetary policy weighing on the Pound in the mid-term.
The British Pound (GBP) is trimming previous gains against the US Dollar (USD) on Monday, returning to the mid-range of the 1.3400s down from fresh seven-week highs, above 1.3500 earlier on the day. Weaker-than-expected UK manufacturing data added pressure on the Pound, which rallied at the Asian session opening, amid news of a halt to the hostilities in Iran.
July’s UK S&P Global Manufacturing Purchasing Managers’ Index (PMI) has been revised down to a 51.2 reading in July from preliminary estimates of a 52.8 reading. The final figures highlight a moderate slowdown of the sector’s activity, from the 52.5 reading seen in June.
Hopes of Iran peace talks have lifted market sentiment
The Pound, however, is drawing some support from a moderate risk-off mood as the US and Iran halted hostilities, and US President Donald Trump’s affirmed that a new round of negotiations will begin on Monday.
The US Dollar is also struggling in the aftermath of an exceptional coordinated intervention between the US and Japan to shore up an ailing Japanese Yen. The USD/JPY dropped more than 3.5% on Thursday and Friday, and posted another spike on Monday, triggering speculation of another intervention. These sharp declines have reverberated in most US Dollar cross-rates, weighing the Greenback across the board.
Looking forward, Strategists at Brown Brothers Harriman observe “scope for a downward adjustment to UK (interest) rate expectations which is a headwind for GBP.” They note that “the swaps curve implies 50bps of tightening to 4.35% in the next twelve months,” but see room for that pricing to be revised lower.
Aside from the Bank of England's rate decision, BBH also points out that “the BoE also flagged it may further reduce the pace at which it shrinks its bond holdings,” underscoring a more cautious approach to quantitative tightening.
(This story was corrected on August 3 at 10:04 GMT to correct the GBP/USD quote in the first bullet point to 1.3450 from 21.3450, as previously written.)
Economic Indicator
S&P Global Manufacturing PMI
The Manufacturing Purchasing Managers Index (PMI), released on a monthly basis by S&P Global, is a leading indicator gauging business activity in the UK’s manufacturing sector. The data is derived from surveys of senior executives at private-sector companies. Survey responses reflect the change, if any, in the current month compared to the previous month and can anticipate changing trends in official data series such as Gross Domestic Product (GDP), industrial production, employment and inflation. The index varies between 0 and 100, with levels of 50.0 signaling no change over the previous month. A reading above 50 indicates that the manufacturing economy is generally expanding, a bullish sign for the Pound Sterling (GBP). Meanwhile, a reading below 50 signals that activity among goods producers is generally declining, which is seen as bearish for GBP.
Read more.Last release: Mon Aug 03, 2026 08:30
Frequency: Monthly
Actual: 51.9
Consensus: 52.8
Previous: 52.8
Source: S&P Global

Deutsche Bank Research analysts Michael Hsueh and Bryant Xu argue that Gold has been in an explosive price phase since August 2024, but recent moves suggest a muted correction. They highlight downside signals from long-term Gold-to-commodity ratios, yet note regression evidence of limited drawdowns and a fair value model pointing near USD 4,700/oz by year-end, slightly above their USD 4,600/oz Q4 2026 forecast.
Explosive dynamics and fair value
"A statistical measure indicates that the current episode of explosive gold price behaviour began from August 2024 and is ongoing. This provides a useful frame of reference for today’s gold market. The current episode is only one of five appearing in data from 1975 (after filtering out isolated 1-month readings as noise, and aggregating temporally linked observations)."
"First, we adjust gold-to-commodity relative price ratios for long term growth rates. Adjusted ratios indexed to a 1986 reference point imply downside for gold to USD 2,600/oz."
"Second, regressing gold prices on the BSADF test statistic indicates that both gold’s upward extension and downward correction are muted in this episode. Gold may have bottomed in its correction around USD 3,900/oz instead of extending toward the regression-implied USD 3,700/oz."
"Third, gold has closed the gap to fair value. Rolling back our model adjustments for excess official demand and real rate convexity, we would still see gold fair value as likely to register around USD 4,700/oz by year-end, above our USD 4,600/oz forecast for Q4’26. We maintain our forecast on this basis."
"Altogether, we think it is appropriate to maintain our forecasts from the Commodities Outlook, discounting the substantial downside implied by commodity ratios and overweighting the fair value model which aligns with gold’s demonstrated sensitivities to financial market variables and DB research cross-asset views."
(This article was created with the help of an Artificial Intelligence tool and reviewed by an editor. Know more.)
Silver prices (XAG/USD) rose on Monday, according to FXStreet data. Silver trades at $58.38 per troy ounce, up 1.37% from the $57.59 it cost on Friday.
Silver prices have decreased by 17.88% since the beginning of the year.
Unit measure | Silver Price Today in USD |
|---|---|
Troy Ounce | 58.38 |
1 Gram | 1.88 |
The Gold/Silver ratio, which shows the number of ounces of Silver needed to equal the value of one ounce of Gold, stood at 69.56 on Monday, down from 70.19 on Friday.
Silver FAQs
Silver is a precious metal highly traded among investors. It has been historically used as a store of value and a medium of exchange. Although less popular than Gold, traders may turn to Silver to diversify their investment portfolio, for its intrinsic value or as a potential hedge during high-inflation periods. Investors can buy physical Silver, in coins or in bars, or trade it through vehicles such as Exchange Traded Funds, which track its price on international markets.
Silver prices can move due to a wide range of factors. Geopolitical instability or fears of a deep recession can make Silver price escalate due to its safe-haven status, although to a lesser extent than Gold's. As a yieldless asset, Silver tends to rise with lower interest rates. Its moves also depend on how the US Dollar (USD) behaves as the asset is priced in dollars (XAG/USD). A strong Dollar tends to keep the price of Silver at bay, whereas a weaker Dollar is likely to propel prices up. Other factors such as investment demand, mining supply – Silver is much more abundant than Gold – and recycling rates can also affect prices.
Silver is widely used in industry, particularly in sectors such as electronics or solar energy, as it has one of the highest electric conductivity of all metals – more than Copper and Gold. A surge in demand can increase prices, while a decline tends to lower them. Dynamics in the US, Chinese and Indian economies can also contribute to price swings: for the US and particularly China, their big industrial sectors use Silver in various processes; in India, consumers’ demand for the precious metal for jewellery also plays a key role in setting prices.
Silver prices tend to follow Gold's moves. When Gold prices rise, Silver typically follows suit, as their status as safe-haven assets is similar. The Gold/Silver ratio, which shows the number of ounces of Silver needed to equal the value of one ounce of Gold, may help to determine the relative valuation between both metals. Some investors may consider a high ratio as an indicator that Silver is undervalued, or Gold is overvalued. On the contrary, a low ratio might suggest that Gold is undervalued relative to Silver.
(An automation tool was used in creating this post.)
- Silver price faces pressure in extending the opening advance above $58.70.
- Oil prices decline significantly on US-Iran ceasefire 2.0.
- The Fed is expected to hike interest rates in the September policy meeting.
Silver price (XAG/USD) opens strongly due to a sharp decline in oil prices, but struggles to extend gains beyond $58.68 during the day. At press time, the Silver price is up 1% to near $58.20.
The white metal has started the week on a firm footing as lower oil prices due to the announcement of a ceasefire 2.0 between the United States (US) and Iran have anchored global inflation expectations.
Over the weekend, US President Donald Trump announced, through a post on Truth Social, that planned attacks on Iran have been suspended as Tehran has agreed to the nuclear deal and the reopening of the Strait of Hormuz, a vital passage to almost 20% of global energy supply.
The Silver price has underperformed significantly in the past few months as oil prices fuelled global inflation projections, a scenario that forces central banks to tighten monetary conditions. Such a case bodes poorly for non-yielding assets, like Silver.
It is highly likely that the hawkish Federal Reserve (Fed) will restrict Silver’s upside. Analysts at Deutsche Bank expect two further 25bps increases this year. According to the CME FedWatch tool, the odds of the Fed hiking interest rates next month are 64.5%.
Silver technical analysis
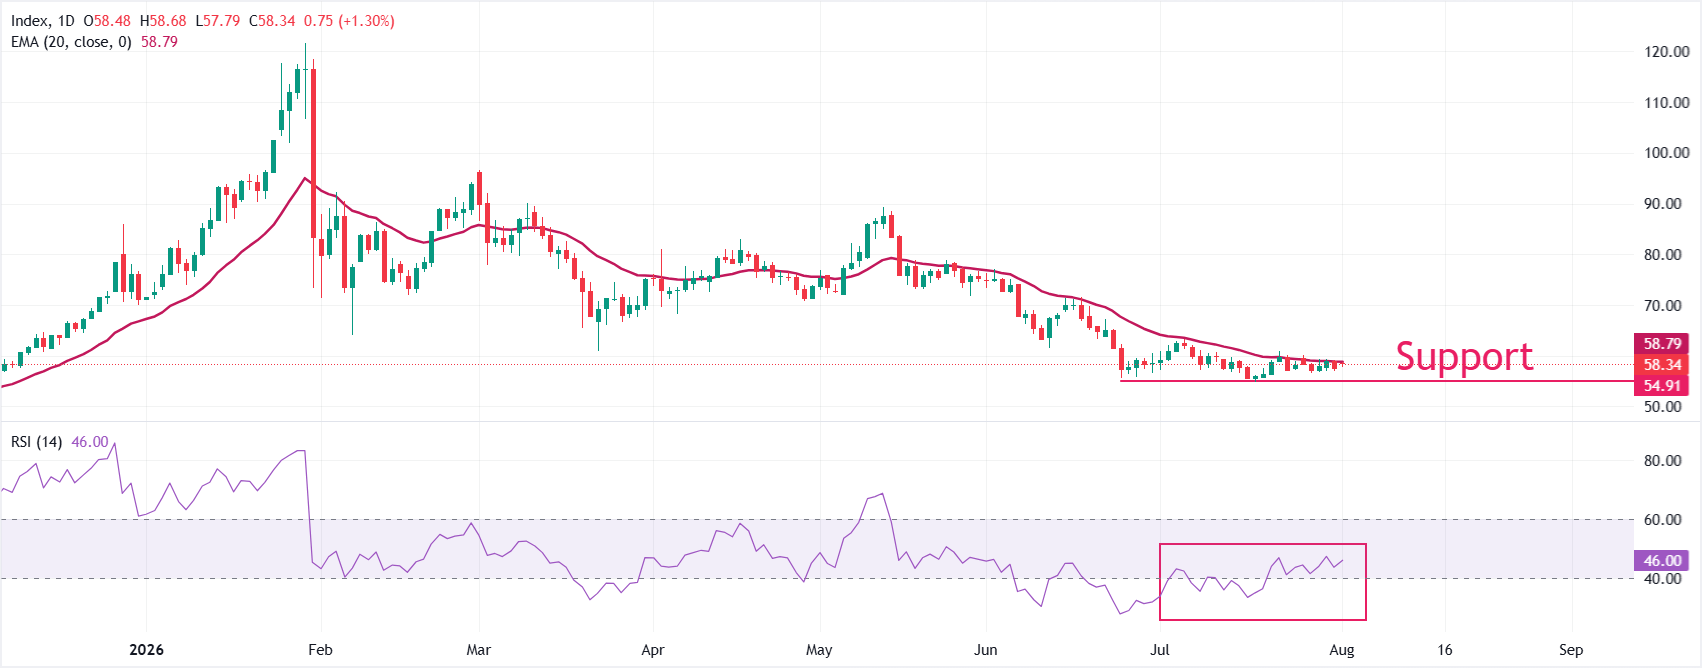
Bias: XAG/USD trades higher at around $58.20, but is keeping a bearish near-term tone as it holds beneath the 20-day Exponential Moving Average (EMA) at $58.79.
Momentum: The price's failure to reclaim this short-term EMA suggests rallies remain capped for now, while the Relative Strength Index (RSI) at 46 stays in neutral territory on the daily chart, hinting at modest downside pressure rather than a decisive trend move.
Resistance: On the topside, initial resistance is located at the 20-day EMA at $58.79, and a sustained break above this barrier would be needed to ease the current bearish bias and open the way for $60.00.
Support: Looking down, the July 17 low at $54.77 is the key support zone.
(The technical analysis of this story was written with the help of an AI tool. Know more.)
Silver FAQs
Silver is a precious metal highly traded among investors. It has been historically used as a store of value and a medium of exchange. Although less popular than Gold, traders may turn to Silver to diversify their investment portfolio, for its intrinsic value or as a potential hedge during high-inflation periods. Investors can buy physical Silver, in coins or in bars, or trade it through vehicles such as Exchange Traded Funds, which track its price on international markets.
Silver prices can move due to a wide range of factors. Geopolitical instability or fears of a deep recession can make Silver price escalate due to its safe-haven status, although to a lesser extent than Gold's. As a yieldless asset, Silver tends to rise with lower interest rates. Its moves also depend on how the US Dollar (USD) behaves as the asset is priced in dollars (XAG/USD). A strong Dollar tends to keep the price of Silver at bay, whereas a weaker Dollar is likely to propel prices up. Other factors such as investment demand, mining supply – Silver is much more abundant than Gold – and recycling rates can also affect prices.
Silver is widely used in industry, particularly in sectors such as electronics or solar energy, as it has one of the highest electric conductivity of all metals – more than Copper and Gold. A surge in demand can increase prices, while a decline tends to lower them. Dynamics in the US, Chinese and Indian economies can also contribute to price swings: for the US and particularly China, their big industrial sectors use Silver in various processes; in India, consumers’ demand for the precious metal for jewellery also plays a key role in setting prices.
Silver prices tend to follow Gold's moves. When Gold prices rise, Silver typically follows suit, as their status as safe-haven assets is similar. The Gold/Silver ratio, which shows the number of ounces of Silver needed to equal the value of one ounce of Gold, may help to determine the relative valuation between both metals. Some investors may consider a high ratio as an indicator that Silver is undervalued, or Gold is overvalued. On the contrary, a low ratio might suggest that Gold is undervalued relative to Silver.

Commerzbank strategists report that Brent Oil opened over 7% lower under USD84 into the Asian session after President Trump said the United States (US) would hold off on new strikes against Iran. Despite OPEC+ approving a modest output increase for September, the Strait of Hormuz remains effectively closed, keeping Persian Gulf export disruptions and inflation concerns in focus.
Trump decision hits Brent sharply
"The dominant story heading into the Asian open is that Brent oil prices have opened lower by over 7% to under USD84. This followed reports over the weekend that President Donald Trump said the US would hold off on new strikes against Iran. Iran and other Gulf nations indicated they are working toward a deal."
"President Trump posted on social media that he had agreed to cancel the attack “subject to being able to rapidly make a DEAL”, adding “Get to work, everybody, and get it DONE”. Saudi Arabian Crown Prince Mohammed bin Salman had reportedly urged Trump to refrain from further military action."
"On the energy front, OPEC+ approved a further increase of 188k barrels a day to collective output targets for September on Sunday, completing the theoretical unwinding of the 1.65mn barrels a day in voluntary cuts made in April 2023."
"The Strait of Hormuz remains effectively closed, continuing to disrupt Persian Gulf oil exports and stoking inflation concerns across Asia and Africa."
(This article was created with the help of an Artificial Intelligence tool and reviewed by an editor. Know more.)

- July Swiss CPI rose just 0.4% year-on-year, marking the slowest price growth since March.
- Switzerland's SVME Manufacturing PMI fell to 53.2 in July, hitting a six-month low.
- USD upside remains capped by joint US-Japan intervention and easing Middle East geopolitical tension.
USD/CHF extends its gains for the second successive day, trading around 0.8090 during the European hours on Monday. The pair remains on a stronger footing as the Swiss Franc (CHF) holds onto losses following the release of soft domestic inflation and manufacturing data.
In July, Swiss consumer prices rose by just 0.4% year-on-year, marking the slowest pace of growth since March and easing from a 0.5% gain in June. Annual core inflation, which excludes volatile items like unprocessed food and energy, held steady at 0.3%. On a monthly basis, consumer prices slipped by 0.1%, the first contraction in six months after a flat reading in June.
Franc outlook softens as Nomura sees Swiss inflation undershooting SNB
Strategists at Nomura highlight that “car fuel prices contributed to the slowdown in Swiss inflation in July,” reinforcing the recent disinflationary trend. Against this backdrop, they add that “we expect inflation in Q3 to print below the SNB’s forecast,” suggesting a softer fundamental environment for the Swiss Franc.
Compounding the Franc's weakness, Switzerland’s SVME Manufacturing PMI fell to 53.2 in July from 54.3 in June, missing market expectations of 55.0 and recording its lowest level since February.
However, the upside for the USD/CHF pair may be constrained by broad-based weakness in the US Dollar (USD) following official confirmation of joint foreign exchange interventions by Japan and the United States. Japanese authorities confirmed coordinated yen-buying operations, with Bank of Japan data revealing expenditures reaching up to $58.97 billion. Tokyo signaled a readiness to intervene further if necessary, emphasizing ongoing, close communication with US counterparts.
Moreover, the Greenback faces challenges amid easing market risk aversion, driven by potential diplomatic progress between Washington and Tehran. Market sentiment brightened after US President Donald Trump announced a pause on planned military strikes. In a post on Truth Social, President Trump noted that Iran and regional partners had requested time to negotiate a deal aimed at fully reopening the Strait of Hormuz and addressing concerns over Iran's nuclear program.
US data in focus as markets weigh Fed reaction and credibility
Strategists at BNY Mellon argue that the coming week will "test whether markets can keep looking through policy uncertainty while demanding firmer evidence from data and earnings," with U.S. nonfarm payrolls singled out as "the main event." They note that "the Fed’s reaction function is harder to read," leaving "its credibility tied to incoming data" as investors assess how labor-market prints and corporate results shape expectations for the policy path.

- Gold kicks off the new week on a positive note, though it lacks any follow-through buying.
- Falling oil prices ease inflation fears and temper Fed hike bets, supporting the commodity.
- A modest USD bounce from its lowest level since June 17 caps gains for the XAU/USD pair.
Gold (XAU/USD) extends its sideways consolidative price move through the first half of the European session and trades above the $4,050 level following a modest bullish gap on Monday. A goodish US Dollar (USD) recovery from its lowest level since June 17 is seen as a key factor capping the upside for the commodity. However, receding hopes for a US-Iran peace deal and receding US Federal Reserve (Fed) rate-hike expectations could cap a further USD appreciation. This, in turn, might hold back traders from placing aggressive bearish bets on the non-yielding yellow metal.
US President Donald Trump called off planned attacks on Iran over the weekend, claiming that Mideast allies have reached the parameters of a deal on Tehran's nuclear program and the full reopening of the Strait of Hormuz. Trump further told reporters that the US and Iran are set to resume negotiations Monday afternoon, fueling optimism over a diplomatic resolution to end the five-month-old war. Adding to this, the OPEC+ decision on Sunday to increase production in September triggered a steep decline in crude oil prices. This eases inflation fears and tempers bets for a more aggressive Fed policy tightening, which should keep a lid on any meaningful USD appreciation and support the Gold price.
Traders, however, seem hesitant to place fresh bearish bets around the USD and opt to wait for further developments around the Middle East crisis. Hence, the focus remains glued to incoming geopolitical headlines, which might continue to infuse volatility in financial markets and drive the USD demand. Apart from this, traders will take cues from important US macro data, scheduled at the start of a new month, for some meaningful impetus. A busy week kicks off with the release of the US ISM Manufacturing PMI later this Monday. The market attention, meanwhile, stays on the crucial US monthly employment details, popularly known as the Nonfarm Payrolls (NFP) report on Friday.
XAU/USD daily chart
Technical Analysis: Gold seems vulnerable within a familiar range below 200-day SMA
From a technical perspective, nothing seems to have changed much as the XAU/USD pair remains confined in a familiar range below the 200-day Simple Moving Average (SMA). Against the backdrop of the recent downfall, this might still be categorized as a bearish consolidation phase and suggests that the path of least resistance for the Gold price remains to the downside.
Meanwhile, the Moving Average Convergence Divergence (MACD) indicator (12, 26, close, 9) stays in positive territory with a reading near 11.6, hinting at tentative upside momentum. However, the Relative Strength Index (14) at 47.1 remains neutral and suggests only limited directional conviction. Hence, any further move up might struggle to find acceptance above $4,100.
The said handle is followed by the top boundary of the trading range, just ahead of the $4,200 mark, which, if cleared decisively, could lift Gold to the 200-day SMA near $4,490.33. Bulls would need to reclaim a technically significant barrier to alleviate the prevailing bearish tone and reopen the path toward higher highs.
On the downside, immediate support is inferred from recent swing lows around the $3,976–$4,000 area, where buyers previously emerged. A convincing break below would be seen as a fresh trigger for bearish traders and turn the XAU/USD pair vulnerable to further declines.
(The technical analysis of this story was written with the help of an AI tool. Know more.)
Inflation FAQs
Inflation measures the rise in the price of a representative basket of goods and services. Headline inflation is usually expressed as a percentage change on a month-on-month (MoM) and year-on-year (YoY) basis. Core inflation excludes more volatile elements such as food and fuel which can fluctuate because of geopolitical and seasonal factors. Core inflation is the figure economists focus on and is the level targeted by central banks, which are mandated to keep inflation at a manageable level, usually around 2%.
The Consumer Price Index (CPI) measures the change in prices of a basket of goods and services over a period of time. It is usually expressed as a percentage change on a month-on-month (MoM) and year-on-year (YoY) basis. Core CPI is the figure targeted by central banks as it excludes volatile food and fuel inputs. When Core CPI rises above 2% it usually results in higher interest rates and vice versa when it falls below 2%. Since higher interest rates are positive for a currency, higher inflation usually results in a stronger currency. The opposite is true when inflation falls.
Although it may seem counter-intuitive, high inflation in a country pushes up the value of its currency and vice versa for lower inflation. This is because the central bank will normally raise interest rates to combat the higher inflation, which attract more global capital inflows from investors looking for a lucrative place to park their money.
Formerly, Gold was the asset investors turned to in times of high inflation because it preserved its value, and whilst investors will often still buy Gold for its safe-haven properties in times of extreme market turmoil, this is not the case most of the time. This is because when inflation is high, central banks will put up interest rates to combat it. Higher interest rates are negative for Gold because they increase the opportunity-cost of holding Gold vis-a-vis an interest-bearing asset or placing the money in a cash deposit account. On the flipside, lower inflation tends to be positive for Gold as it brings interest rates down, making the bright metal a more viable investment alternative.

Rabobank's Senior FX Strategist Jane Foley discusses recent joint intervention by Japan’s Ministry of Finance (MoF) and the United States (US) Treasury to support the Japanese Yen (JPY) and its implications for USD/JPY. Foley highlights use of the Federal Reserve’s (Fed) Foreign and International Monetary Authorities (FIMA) Repo Facility, questions over Bank of Japan (BoJ) rate hikes, and suggests the 200-day sma near USD/JPY158 may act as resistance, limiting further US Dollar (USD) gains.
Joint support and policy uncertainty
"The joint intervention between the MoF and the US Treasury that has played out in recent days is more like the action last seen during the Clinton Administration in 1998 when both authorities set out to support the JPY. One interesting question regarding the Treasury’s decision to act in recent days is ‘what is in it’ for the US? Another key question is whether the JPY can sustain its better tone."
"The use of the FIMA by the MoF in its support of the JPY backed up by action from the Fed may have been a useful short-term solution for both the Japanese and US authorities. That said, FX intervention will only be successful in turning a currency pair if the fundamentals are also pushing in the same direction. Whether this is the case has yet to be established."
"He stated that underlying inflation was at risk of rising above the BoJ’s 2% target and suggested that there was the possibility of speeding up the pace of hikes. That said, perhaps understandably, there was no clear commitment to do so, and this will have disappointed JPY bulls. Meanwhile, the market remains wary about the weight of government debt."
"While we are optimistic regarding the changes to Japan’s economy in recent years, the market will likely have to become more confident that the BoJ can hasten the pace of rate hikes and see more reassurances on fiscal prudence for the JPY to recover significant ground. While more economic data and news of Takaichi’s fiscal credibility is awaited, for now fear of further intervention and a weaker USD will likely be sufficient to prevent USD/JPY from pushing much higher. The 200-day sma close to USD/JPY158 is likely to act as resistance."
(This article was created with the help of an Artificial Intelligence tool and reviewed by an editor. Know more.)

- AUD/JPY dives to its lowest level since March, though it finds some support near the 200-day SMA.
- The oversold RSI on the daily chart helps spot prices defend a technically significant SMA support.
- The broader setup favors bears and suggests that the path of least resistance is to the downside.
The AUD/JPY cross attracts heavy follow-through selling and touches its lowest level since late March, around the 109.40-109.35 region at the start of a new week. Spot prices, however, defend a technically significant 200-day Simple Moving Average (SMA) and trade around the 110.00 psychological mark during the first half of the European session, still down nearly 0.50% for the day.
The Japanese Yen (JPY) continues with its relative outperformance on the back of a joint US-Japan FX intervention on Friday and hints of further action. Furthermore, the Bank of Japan's (BoJ) readiness to continue pushing up borrowing costs lends additional support to the JPY, which, in turn, is seen as a key factor weighing on the AUD/JPY cross. Apart from this, diminishing odds of an immediate interest rate hike by the Reserve Bank of Australia (RBA) undermine the Australian Dollar (AUD) and suggest that the path of least resistance for the currency pair is to the downside.
From a technical perspective, an intraday failure near the 111.25-111.15 region reaffirms Friday's breakdown through a nearly four-month-old trading range and validates the near-term negative outlook for the AUD/JPY cross. Adding to this, the Moving Average Convergence Divergence (MACD) has turned deeper into negative ground, hinting at lingering downside momentum. However, the daily Relative Strength Index (14) has slipped to oversold territory near 27, making it prudent to wait for a break below the 200-day SMA at 109.25 before positioning for further losses.
A clear break below this floor would likely expose the AUD/JPY cross to a more decisive bearish phase. On the flip side, any attempted recovery might continue to face stiff resistance and remain capped near the 111.15-111.25 region, which, if cleared, might trigger a short-covering move. The broadly bearish technical setup, however, would warrant caution before confirming that the recent corrective decline from the vicinity of the 115.00 psychological mark has run its course and that spot prices have formed a near-term bottom.
AUD/JPY daily chart
Japanese Yen Price This week
The table below shows the percentage change of Japanese Yen (JPY) against listed major currencies this week. Japanese Yen was the strongest against the New Zealand Dollar.
| USD | EUR | GBP | JPY | CAD | AUD | NZD | CHF | |
|---|---|---|---|---|---|---|---|---|
| USD | 0.21% | 0.27% | -0.17% | 0.20% | 0.41% | 0.52% | 0.31% | |
| EUR | -0.21% | 0.07% | -0.33% | 0.00% | 0.30% | 0.32% | 0.10% | |
| GBP | -0.27% | -0.07% | -0.74% | -0.07% | 0.24% | 0.25% | 0.03% | |
| JPY | 0.17% | 0.33% | 0.74% | 0.43% | 0.71% | 0.79% | 0.57% | |
| CAD | -0.20% | -0.00% | 0.07% | -0.43% | 0.29% | 0.36% | 0.10% | |
| AUD | -0.41% | -0.30% | -0.24% | -0.71% | -0.29% | 0.00% | -0.18% | |
| NZD | -0.52% | -0.32% | -0.25% | -0.79% | -0.36% | -0.00% | -0.22% | |
| CHF | -0.31% | -0.10% | -0.03% | -0.57% | -0.10% | 0.18% | 0.22% |
The heat map shows percentage changes of major currencies against each other. The base currency is picked from the left column, while the quote currency is picked from the top row. For example, if you pick the Japanese Yen from the left column and move along the horizontal line to the US Dollar, the percentage change displayed in the box will represent JPY (base)/USD (quote).
(The technical analysis of this story was written with the help of an AI tool. Know more.)

