


OCBC strategists Sim Moh Siong and Christopher Wong highlight that USD/CNH dipped after a stronger USD/CNY fix below 6.80, the first such level since February 2023. They read this as policymakers being comfortable with further RMB appreciation while managing the pace. Technically, they see mild bullish momentum in USD/CNH, with support at 6.75/76 and resistance at 6.80 and 6.8320.
PBoC fix strategy and key levels
"USD/CNH dipped, taking cues from a lower USD/CNY fix on Friday. The fix was set at 6.7989, below 6.80 for the first time since Feb 2023 and lower than 6.8036 prior. But the fix was still 51 pips weaker than Bloomberg consensus at 6.7938."
"This may suggest that policymakers are comfortable with further RMB appreciation but remain mindful of the pace. Further fixes below 6.80 should be supportive of RMB, though the gap against market expectations will remain important in interpreting PBoC’s bias."
"USD/CNH last at 6.7820 levels. Mild bullish momentum on daily chart intact while RSI looks flat. 2-way trade still likely. Support at 6.75/76 levels. Resistance at 6.80, 6.8320 (DMA)."
(This article was created with the help of an Artificial Intelligence tool and reviewed by an editor. Know more.)

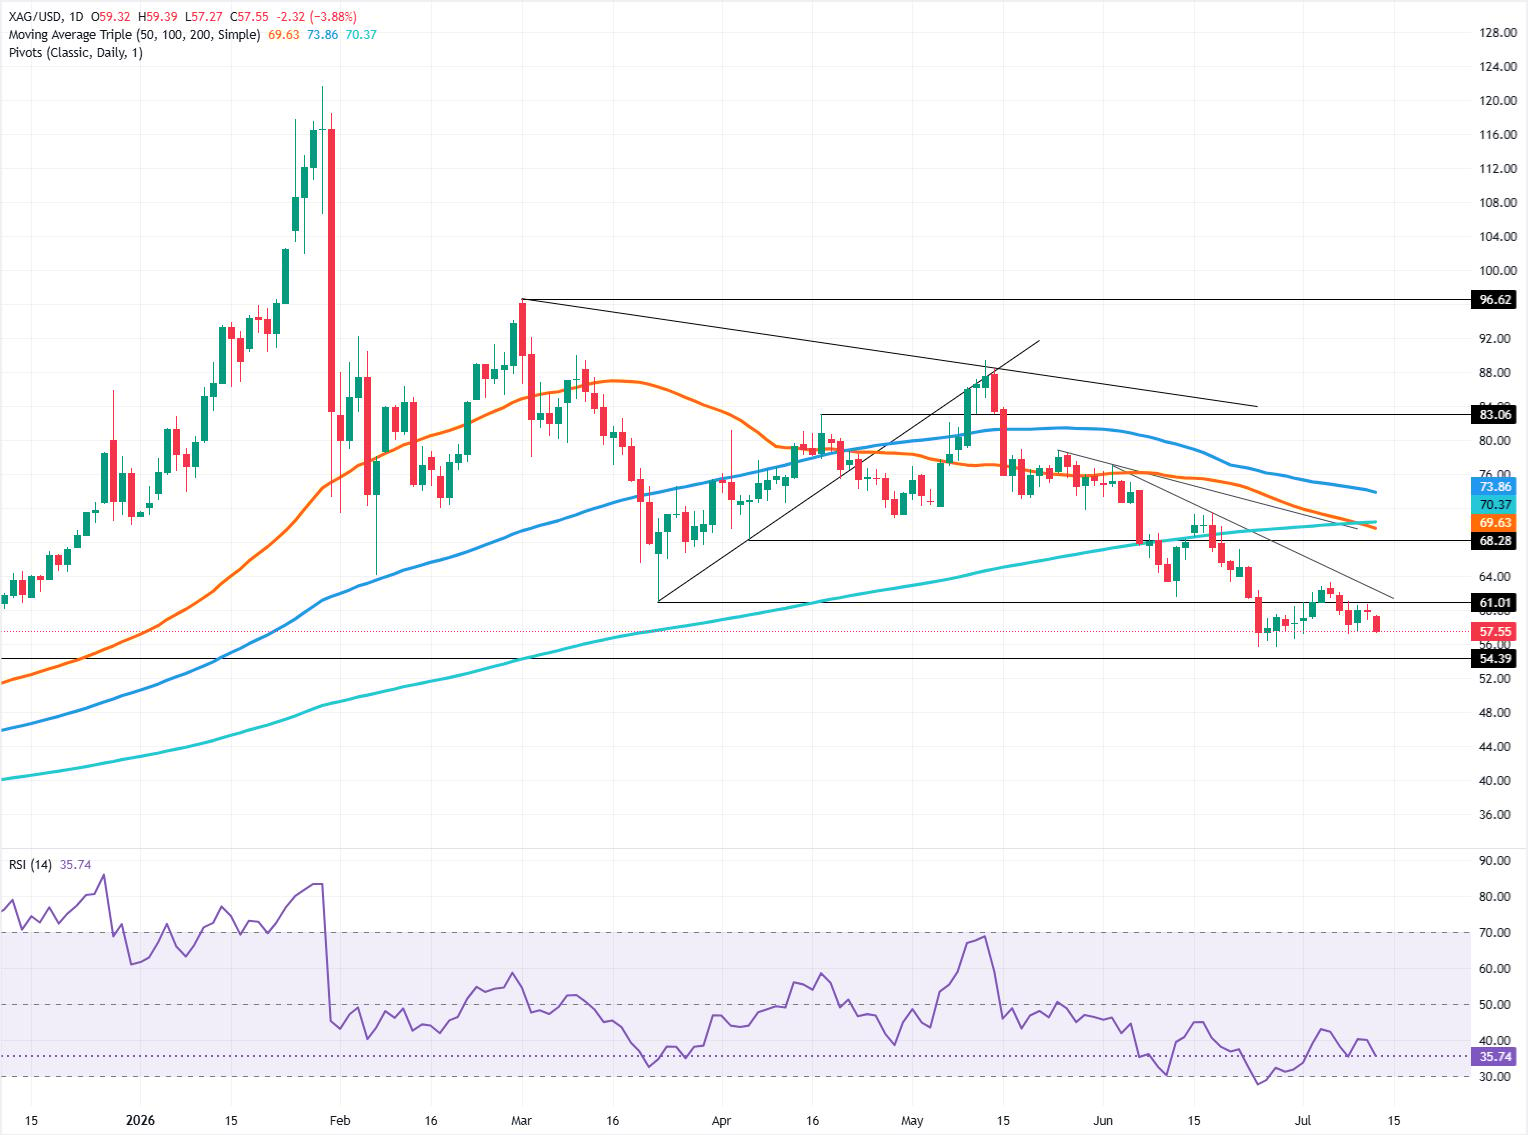
- Silver respects lower-high structure as sellers pressure $57.22 support.
- Break below $57.22 exposes $54.39 and $50.00 downside targets.
- Bullish recovery requires clearing $62.50 trendline and $63.28 high.
Silver price remains below $60.00 as the week begins, diving nearly 4% on Monday amid tensions in the Middle East. Hawkish remarks by Federal Reserve (Fed) Governor Christopher Waller underpin the Greenback, which, according to the US Dollar Index (DXY), is up by over 0.28%. The XAG/USD trades at $57.50.
XAG/USD price forecast: Technical outlook
The downtrend in Silver seems poised to continue as the market structure of successive lower highs and lower lows is respected. Also, the XAG/USD is about to breach the July 8 daily low of $57.22, which if achieved would open the path to test the November 13, 2025 high, which has since turned support at $54.39. On further weakness, the next area of interest would be the $50.00 milestone.
Conversely, for a bullish resumption, XAG/USD must clear a key resistance trendline at around $62.25-$62.50, before interrupting the downward market structure if bulls clear the July 6 high at $63.28. If hurdled, this clears the way to challenge $65.00. Once surpassed, Silver could aim toward the $70.00 region.
XAG/USD Price Chart - Daily
Silver FAQs
Silver is a precious metal highly traded among investors. It has been historically used as a store of value and a medium of exchange. Although less popular than Gold, traders may turn to Silver to diversify their investment portfolio, for its intrinsic value or as a potential hedge during high-inflation periods. Investors can buy physical Silver, in coins or in bars, or trade it through vehicles such as Exchange Traded Funds, which track its price on international markets.
Silver prices can move due to a wide range of factors. Geopolitical instability or fears of a deep recession can make Silver price escalate due to its safe-haven status, although to a lesser extent than Gold's. As a yieldless asset, Silver tends to rise with lower interest rates. Its moves also depend on how the US Dollar (USD) behaves as the asset is priced in dollars (XAG/USD). A strong Dollar tends to keep the price of Silver at bay, whereas a weaker Dollar is likely to propel prices up. Other factors such as investment demand, mining supply – Silver is much more abundant than Gold – and recycling rates can also affect prices.
Silver is widely used in industry, particularly in sectors such as electronics or solar energy, as it has one of the highest electric conductivity of all metals – more than Copper and Gold. A surge in demand can increase prices, while a decline tends to lower them. Dynamics in the US, Chinese and Indian economies can also contribute to price swings: for the US and particularly China, their big industrial sectors use Silver in various processes; in India, consumers’ demand for the precious metal for jewellery also plays a key role in setting prices.
Silver prices tend to follow Gold's moves. When Gold prices rise, Silver typically follows suit, as their status as safe-haven assets is similar. The Gold/Silver ratio, which shows the number of ounces of Silver needed to equal the value of one ounce of Gold, may help to determine the relative valuation between both metals. Some investors may consider a high ratio as an indicator that Silver is undervalued, or Gold is overvalued. On the contrary, a low ratio might suggest that Gold is undervalued relative to Silver.

- USD/JPY trades higher as rising Oil prices and US-Iran tensions support the US Dollar while weighing on Yen.
- Trump restarts blockade of Hormuz, while Iran says the Strait is closed.
- Investors await US June CPI, with softer inflation potentially weakening the Greenback, while stronger price pressure could support a more restrictive Fed.
USD/JPY trades higher near 162.40 on Monday as the Japanese Yen (JPY) weakens amid escalating tensions between the United States (US) and Iran. The US Dollar (USD) remains supported by higher Oil prices and growing concerns that renewed energy pressure could keep global inflation elevated.
US President Donald Trump said the Strait of Hormuz would remain open “with or without Iran” and announced the reinstatement of a blockade targeting Iranian ships and customers. Trump also declared the US the “Guardian of the Hormuz Strait” and proposed charging 20% on cargo transported through the waterway to cover security costs.
Iran rejected Washington’s involvement, saying that the US would not be allowed to determine how the Strait is managed. Tehran also warned that any unauthorized US attempt to transit the waterway would be strongly confronted and that cooperation between regional countries and Washington could be considered an act of war.
On the US side, investors await the June Consumer Price Index (CPI) report. Headline inflation is expected to ease to 3.8% YoY from 4.2%, while the monthly reading is forecast to decline 0.1% after rising 0.5%. Core CPI is projected to remain unchanged at 2.9% YoY and 0.2% MoM. Softer-than-expected inflation could weaken the Greenback, while stronger price pressure, particularly amid rising energy costs, could reinforce expectations that the Federal Reserve (Fed) will maintain a restrictive policy stance.
Short-term technical analysis:
On the 4-hour chart, USD/JPY trades at 162.46, maintaining a constructive bullish bias as it holds above the 20-period Simple Moving Average (SMA) near 162.14 and the 100-period SMA near 161.89. The cluster of nearby supports reinforces the uptrend structure, while the Relative Strength Index (RSI) at about 58 stays in positive territory, hinting that upward momentum remains in place rather than stretched.
On the topside, immediate resistance appears at the horizontal barrier around 162.47, where a clear break would open the way for further gains. On the downside, initial support is seen at 162.41, followed by 162.33 and 162.26, with the 20-period SMA at 162.14 and the 100-period SMA at 161.89, offering deeper layers of demand if a pullback develops.
(The technical analysis of this story was written with the help of an AI tool. Know more.)
- The US Dollar regains momentum after hawkish remarks from Fed Governor Christopher Waller.
- Markets now price in a 41% chance of a Fed interest rate hike this month.
- US CPI data takes centre stage on Tuesday ahead of Fed Chair Kevin Warsh’s two-day congressional testimony.
The US Dollar Index (DXY) regains momentum on Monday after hawkish remarks from Federal Reserve (Fed) Governor Christopher Waller boosted expectations of an interest rate hike as early as this month.
At the time of writing, the index, which tracks the Greenback’s value against a basket of six major currencies, trades around 101.25, recovering from an intraday low of 100.80.
Speaking at the New York Association for Business Economics on Monday, Waller said, “There is still a credible case for inflation to begin to fall back to our 2% goal with policy at its current setting. But I am concerned about the equally plausible case that data in the coming weeks will show that inflation will remain at its elevated level or even trend higher, requiring tighter monetary policy in the near term.”
According to the CME FedWatch Tool, traders are now pricing in a 41% chance of a rate hike at the July meeting, up from 25% a week ago, while the probability of a September hike has risen to 75%.
Attention now turns to Tuesday's US Consumer Price Index (CPI) report, where headline inflation is expected to fall 0.1% MoM in June following a 0.5% increase in May, while core CPI is seen holding steady at 0.2%.
Oil-driven inflation risks are also back in focus after renewed fighting in the Middle East raised fresh concerns about supply disruptions through the Strait of Hormuz, which carries around 20% of global Oil supplies.
Tehran claimed it has once again closed the Strait, while US President Donald Trump said in a Truth Social post that the waterway "is OPEN, and will remain OPEN, with or without Iran," adding that the US would reinstate the blockade of Iranian ships in the Strait.
West Texas Intermediate (WTI) trades around $77.72, up more than 8% on the day and at its highest level since June 22.
With Fed tightening expectations strengthening and geopolitical tensions offering additional support, the US Dollar’s path of least resistance remains tilted to the upside.
Traders will also watch Fed Chair Kevin Warsh’s congressional testimony on Tuesday and Wednesday for fresh policy signals.
US Dollar Price Today
The table below shows the percentage change of US Dollar (USD) against listed major currencies today. US Dollar was the strongest against the Swiss Franc.
| USD | EUR | GBP | JPY | CAD | AUD | NZD | CHF | |
|---|---|---|---|---|---|---|---|---|
| USD | 0.25% | 0.33% | 0.47% | -0.04% | 0.48% | 0.14% | 0.66% | |
| EUR | -0.25% | 0.09% | 0.22% | -0.29% | 0.24% | -0.07% | 0.43% | |
| GBP | -0.33% | -0.09% | 0.15% | -0.38% | 0.17% | -0.15% | 0.38% | |
| JPY | -0.47% | -0.22% | -0.15% | -0.51% | 0.01% | -0.29% | 0.25% | |
| CAD | 0.04% | 0.29% | 0.38% | 0.51% | 0.54% | 0.25% | 0.77% | |
| AUD | -0.48% | -0.24% | -0.17% | -0.01% | -0.54% | -0.27% | 0.25% | |
| NZD | -0.14% | 0.07% | 0.15% | 0.29% | -0.25% | 0.27% | 0.53% | |
| CHF | -0.66% | -0.43% | -0.38% | -0.25% | -0.77% | -0.25% | -0.53% |
The heat map shows percentage changes of major currencies against each other. The base currency is picked from the left column, while the quote currency is picked from the top row. For example, if you pick the US Dollar from the left column and move along the horizontal line to the Japanese Yen, the percentage change displayed in the box will represent USD (base)/JPY (quote).

UOB’s Quek Ser Leang and Lee Sue Ann note that USD/SGD opened stronger after a quiet prior session, with upward momentum tentatively building but still facing resistance around 1.2945–1.2955. For the next 1–3 weeks, they keep its view that USD/SGD will trade between 1.2890 and 1.2990. On a 1–3 month horizon, a break above 1.3000 could target the November 2025 high at 1.3095.
Range bias with upside levels
"24-HOUR VIEW: USD traded in a quiet manner last Thursday. On Friday, we stated that “the price action provides no fresh clues, and USD is likely to trade between 1.2905 and 1.2940.” USD then traded between 1.2896 and 1.2925. USD closed marginally lower by 0.01% at 1.2920, but it opened on a strong note today. Upward momentum is tentatively building, and the bias for USD today is tilted to the upside. However, it is unclear for now whether there is sufficient momentum for a break above 1.2955 (there is another resistance level at 1.2945). On the downside, support levels are at 1.2920 and 1.2910"
"1-3 WEEKS VIEW: We have expected USD to in a range between 1.2890 and 1.2990 since early this month. Last Tuesday (07 Jul, spot at 1.2915), we indicated that “the risk of USD breaking below 1.2890 is increasing.” After USD subsequently rebounded, we highlighted on Thursday (09 Jul, spot at 1.2940) that the recent “mild downward pressure has eased,” and USD “is likely to trade in a range between 1.2890 and 1.2990.” Our view remains unchanged."
(This article was created with the help of an Artificial Intelligence tool and reviewed by an editor. Know more.)

- Waller says hot core CPI could force hike consideration.
- Oil surge revives inflation risks after renewed Hormuz attacks.
- CPI and Warsh testimony could decide Gold’s next break.
Gold price (XAU/USD) plunges on Monday after remarks by Federal Reserve (Fed) Governor Christopher Waller, who revealed that if the Consumer Price Index (CPI) rises this week, the Fed should consider interest rate hikes. The XAU/USD drops nearly 3% below $4,000 as traders eye a retest of the yearly low near $3,900.
XAU/USD dives as Waller ties CPI upside to rate hikes.
Governor Waller stated that a high reading in core inflation “would force near-term consideration of a rate hike.” Despite being hawkish, he still sees it as credible that inflation could reach the 2% goal without higher rates and stated that the labour market is closer to the Fed’s maximum-employment goal.
In the meantime, geopolitics continued to drive Gold prices. The US and Iran exchanged fire over the weekend despite signing a memorandum of understanding (MOU) that intended to keep the ceasefire going.
Tehran’s attacks on shipping vessels prompted retaliation from the US. US CENTCOM confirmed the attacks on more than 100 military targets, aimed at dismantling Iran’s forces near the Strait of Hormuz.
Iran then attacked gulf region nations that host US bases. Tehran said over the weekend that it had closed the Strait of Hormuz to tanker traffic. Energy prices have jumped since the resumption of hostilities amid fears of a supply disruption, with the US crude Oil benchmark, Western Texas Intermediate (WTI), rising nearly 6% on Monday to $75.70.
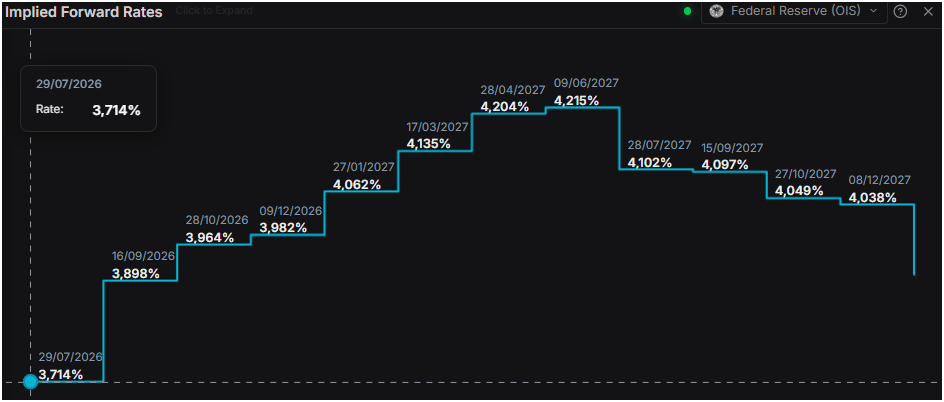
Given the backdrop, investors had priced in 33 basis points of Fed tightening toward the end of the year, according to Prime Terminal data.
Catalysts for the Gold price
Ahead this week, the release of US inflation data and Fed Chair Kevin Warsh's testimony in front of the US Congress could be the main drivers of XAU’s price action. A rise in inflation and a hawkish Warsh could set the table for a rate hike, sooner rather than later.
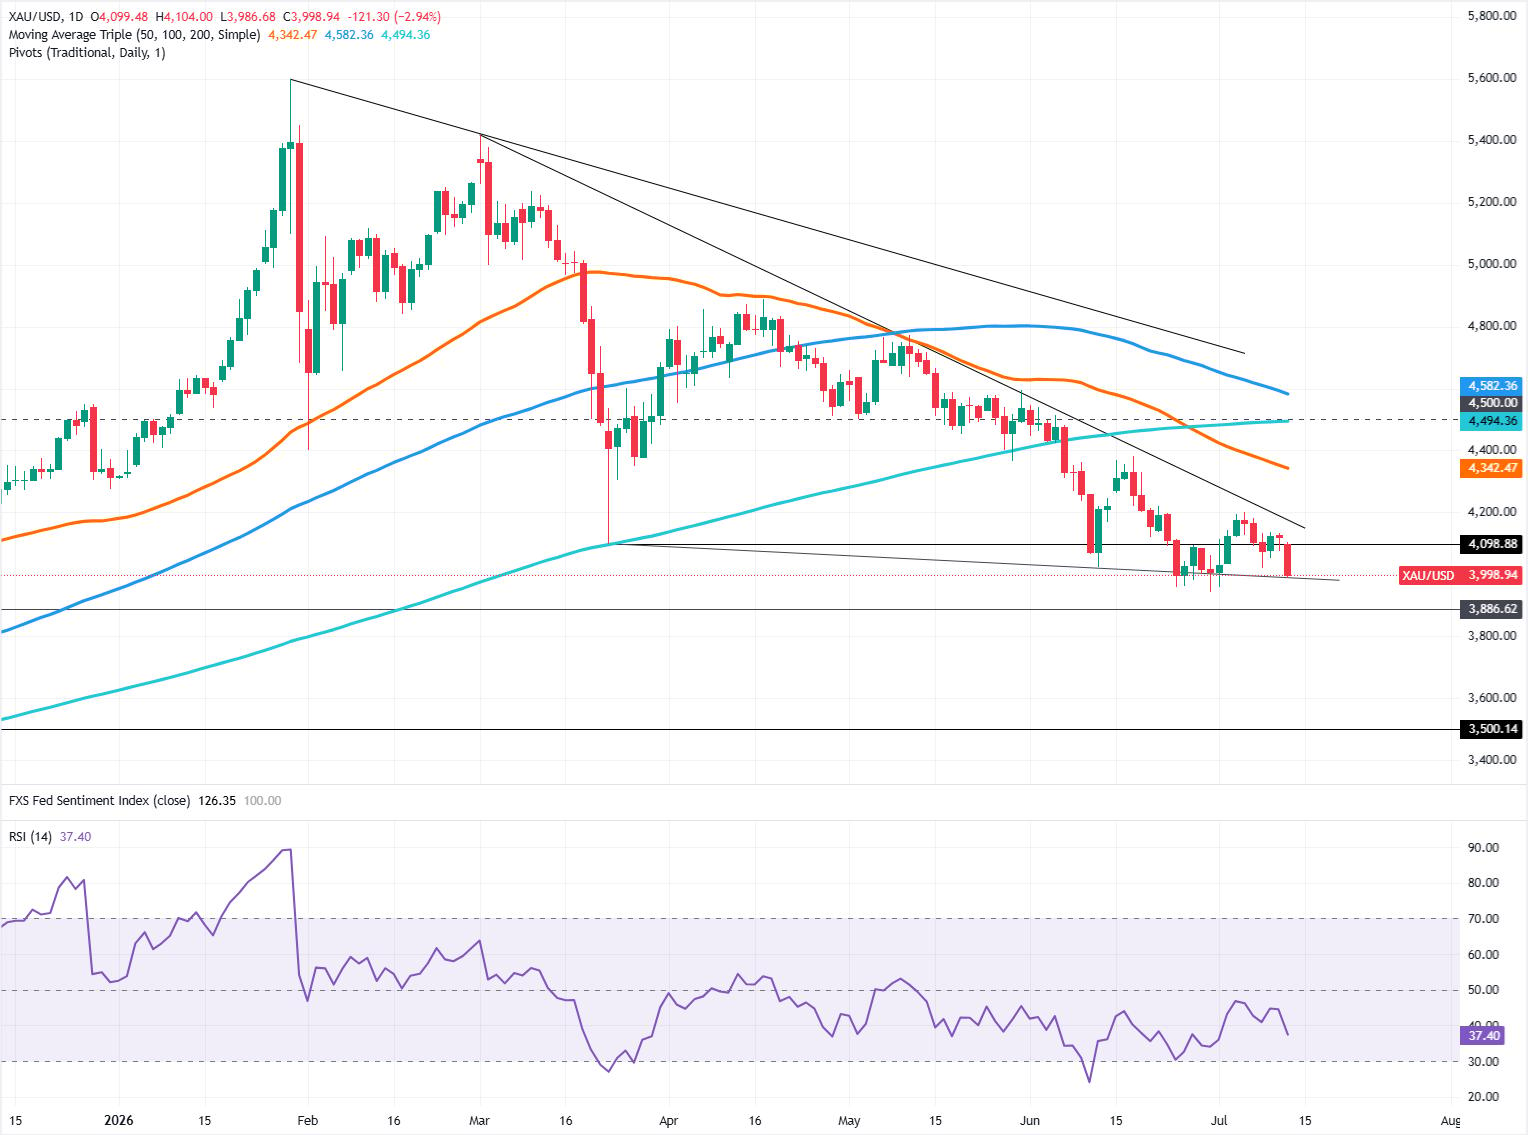
XAU/USD technical outlook: Gold drops below $4,000 on Fed's hawkish tilt
Price action shows that the series of successive lower highs and lower lows is being respected, with Gold poised to continue its downtrend. Bears continued to gather momentum as measured by the Relative Strength Index (RSI), which is approaching oversold territory.
All that said, XAU/USD first support would be the year-to-date (YTD) low of $3,941. A breach of the latter will expose the October 28, 2025 swing low of $3,886 ahead of dropping toward the $3,500 mark.
For a bullish continuation, Gold must surpass the $4,000 figure, followed by a downslope resistance trendline at around $4,170. Above the latter, the $4,200 psychological level looms.
Gold FAQs
Gold has played a key role in human’s history as it has been widely used as a store of value and medium of exchange. Currently, apart from its shine and usage for jewelry, the precious metal is widely seen as a safe-haven asset, meaning that it is considered a good investment during turbulent times. Gold is also widely seen as a hedge against inflation and against depreciating currencies as it doesn’t rely on any specific issuer or government.
Central banks are the biggest Gold holders. In their aim to support their currencies in turbulent times, central banks tend to diversify their reserves and buy Gold to improve the perceived strength of the economy and the currency. High Gold reserves can be a source of trust for a country’s solvency. Central banks added 1,136 tonnes of Gold worth around $70 billion to their reserves in 2022, according to data from the World Gold Council. This is the highest yearly purchase since records began. Central banks from emerging economies such as China, India and Turkey are quickly increasing their Gold reserves.
Gold has an inverse correlation with the US Dollar and US Treasuries, which are both major reserve and safe-haven assets. When the Dollar depreciates, Gold tends to rise, enabling investors and central banks to diversify their assets in turbulent times. Gold is also inversely correlated with risk assets. A rally in the stock market tends to weaken Gold price, while sell-offs in riskier markets tend to favor the precious metal.
The price can move due to a wide range of factors. Geopolitical instability or fears of a deep recession can quickly make Gold price escalate due to its safe-haven status. As a yield-less asset, Gold tends to rise with lower interest rates, while higher cost of money usually weighs down on the yellow metal. Still, most moves depend on how the US Dollar (USD) behaves as the asset is priced in dollars (XAU/USD). A strong Dollar tends to keep the price of Gold controlled, whereas a weaker Dollar is likely to push Gold prices up.

- WTI trades near $75.00, up close to 5% on the session, after rebounding from an early low at $72.53 on renewed Strait of Hormuz escalation.
- Trump reinstated the naval blockade on Iranian shipping and attached a 20% levy to all cargo the United States allows through the waterway.
- The Strategic Petroleum Reserve sits at its lowest level since 1983, stripping the market of its buffer against the next disruption.
Crude Oil is repricing the death of a framework rather than any single missile exchange. West Texas Intermediate trades near $75.00, up close to 5%, with Brent near $80.00, after Trump declared the United States will reinstate its blockade of Iranian shipping and collect 20% of the value of every cargo it allows through the Strait of Hormuz. Barely a week ago the barrel had bled back to pre-war levels near $67.00 as the market priced three weeks of partial normalization; it has now un-priced nearly all of it.
A toll both sides swore was illegal
The memorandum of understanding (MOU) signed in mid-June explicitly barred Tehran from charging commercial ships for passage, a clause Washington spent weeks defending as principle. Oman filed its position at the United Nations' shipping agency, the International Maritime Organization (IMO), that transit through an international strait cannot be tolled, and the IMO's secretary-general said only days ago that charging for Hormuz passage has no legal basis. Every word of that case was aimed at Iran's fee plans; on Monday, Washington photocopied them.
The doctrine is collector-agnostic, which is the detail the announcement ignores. The law of the sea does not care whose navy runs the toll booth, so the market is not truly pricing a 20% levy; it is pricing the fact that neither combatant now accepts a rules-based route back to normal traffic, which turns the strait from a war-risk story with an expiry date into a revenue dispute with none.
The market already pays the fee
Freight is where the toll already exists. Chartering a tanker to lift a cargo from inside the strait to Asia costs roughly double the rate for the same voyage starting outside it, according to shipping-market estimates, with war-risk insurance premiums stacked on top of every transit. Traffic through the waterway runs at roughly a third of its normal pace, and Iranian forces fired warning shots at two ships attempting the passage on Monday morning. Monday's strikes also reached Khuzestan, Iran's main producing province, so the risk now runs on both sides of the ledger, barrels blocked at the strait and barrels hit at the source.
Tehran's own messaging does half the work. Its Strait Authority declared passage unfeasible until stability returns while its diplomats advertised a safe corridor through the same water, and shippers reading both statements sensibly conclude that the only reliable policy is the one priced into their insurance.
An emergency reserve with an emergency of its own
The Strategic Petroleum Reserve (SPR) sits at 319.5 million barrels as of the week ending July 3, its lowest level since April 1983, drained by weekly draws near 6 million barrels under a 172 million barrel pledge made alongside a coordinated International Energy Agency release of 400 million barrels. The stockpile holds less than half its capacity, and Trump conceded at the G7 that without the June deal the reserve was roughly four weeks from running dry.
The commercial side offers no cushion either. Total US inventories including the SPR sit at 734 million barrels, the lowest since 1984; commercial stocks have fallen for ten straight weeks; the hub at Cushing holds under 20 million barrels, near the level where the facility struggles to move Crude Oil out to refiners; and refineries run above 96% utilization into peak driving season. The promised 200 million barrel refill over the coming year quietly adds a new source of demand under the tape.
The week hands the barrel two more tests
The June Consumer Price Index lands Tuesday at 12:30 GMT, with consensus looking for a 0.1% monthly decline on the headline and a deceleration to 3.8% YoY. Monday's energy move arrives too late for June's data but rewrites what the July and August prints are allowed to look like, and the Federal Reserve Chair testifies before Congress at 14:00 GMT the same day with an inflation shock forming in real time.
Wednesday's government inventory data then shows whether the reserve draws and the ten-week commercial slide extended into July. Another large draw against a throttled strait would confirm the squeeze, while a surprise build is the one datapoint that could cool the bid without a peace headline.
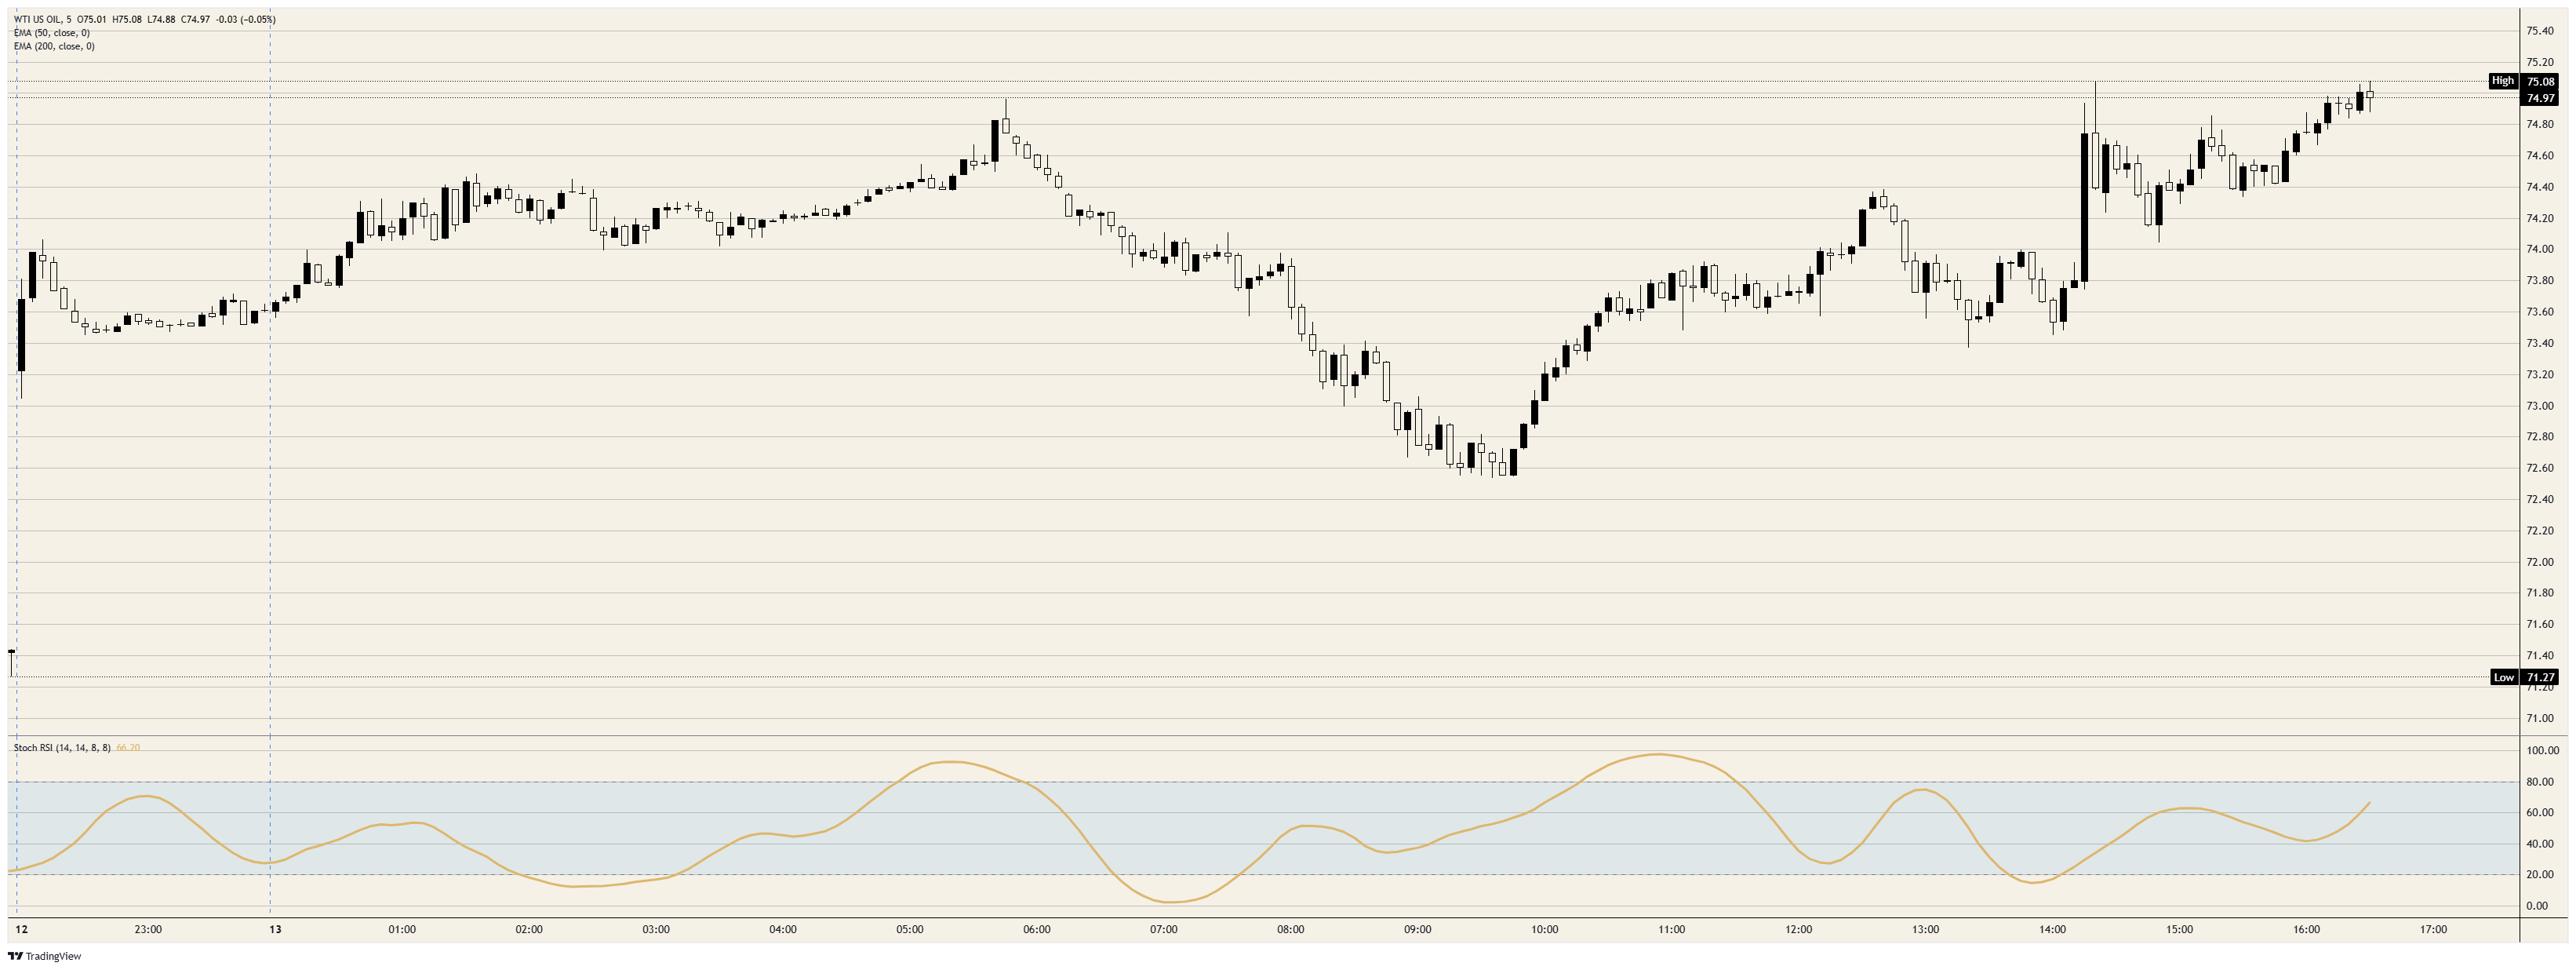
Levels and bias
Resistance: The session high at $75.07 caps the day so far; above it, the 200-day Exponential Moving Average at $77.25 is the first real test, with the 50-day at $80.21 behind it, and both still slope lower after the spring collapse from the May peak at $107.35.
Support: The early low at $72.53 is the near boundary and guards the $70.00 handle; beneath that, the pre-war shelf near $67.09 is the level a genuine de-escalation would target.
Bias: Higher. The daily Stochastic Relative Strength Index is curling up from the mid-30s, the strait runs at a third of capacity, and the buffer that used to cap these squeezes now sits at a 43-year low; dips toward $72.53 are for buying, and only a daily close below that level puts the $70.00 handle back in play.
WTI spot 5-minute chart
WTI Oil FAQs
WTI Oil is a type of Crude Oil sold on international markets. The WTI stands for West Texas Intermediate, one of three major types including Brent and Dubai Crude. WTI is also referred to as “light” and “sweet” because of its relatively low gravity and sulfur content respectively. It is considered a high quality Oil that is easily refined. It is sourced in the United States and distributed via the Cushing hub, which is considered “The Pipeline Crossroads of the World”. It is a benchmark for the Oil market and WTI price is frequently quoted in the media.
Like all assets, supply and demand are the key drivers of WTI Oil price. As such, global growth can be a driver of increased demand and vice versa for weak global growth. Political instability, wars, and sanctions can disrupt supply and impact prices. The decisions of OPEC, a group of major Oil-producing countries, is another key driver of price. The value of the US Dollar influences the price of WTI Crude Oil, since Oil is predominantly traded in US Dollars, thus a weaker US Dollar can make Oil more affordable and vice versa.
The weekly Oil inventory reports published by the American Petroleum Institute (API) and the Energy Information Agency (EIA) impact the price of WTI Oil. Changes in inventories reflect fluctuating supply and demand. If the data shows a drop in inventories it can indicate increased demand, pushing up Oil price. Higher inventories can reflect increased supply, pushing down prices. API’s report is published every Tuesday and EIA’s the day after. Their results are usually similar, falling within 1% of each other 75% of the time. The EIA data is considered more reliable, since it is a government agency.
OPEC (Organization of the Petroleum Exporting Countries) is a group of 12 Oil-producing nations who collectively decide production quotas for member countries at twice-yearly meetings. Their decisions often impact WTI Oil prices. When OPEC decides to lower quotas, it can tighten supply, pushing up Oil prices. When OPEC increases production, it has the opposite effect. OPEC+ refers to an expanded group that includes ten extra non-OPEC members, the most notable of which is Russia.

- AUD/USD trades lower as escalating US-Iran tensions weigh on the risk-sensitive Aussie.
- Trump said the Strait of Hormuz would remain open under US protection, while Iran rejected Washington’s role and warned of its military response.
- Investors await China’s Q2 GDP and activity data, alongside US June CPI, with softer US inflation potentially limiting further USD strength.
AUD/USD trades lower near 0.6930 on Monday, retreating from an opening level of around 0.6950 as escalating tensions between the United States (US) and Iran bolster the safe-haven US Dollar (USD) and weigh on the risk-sensitive Australian Dollar (AUD).
US President Donald Trump said the Strait of Hormuz would remain open “with or without Iran” and announced the reinstatement of a naval blockade targeting Iranian shipping. Trump also declared that the US would become the “Guardian of the Hormuz Strait” and said Washington would seek reimbursement at a rate of 20% on cargo passing through the waterway to cover security costs.
Iran rejected Trump’s remarks, with the country’s top joint military command saying that the US had no role in determining the future of the Strait. Iranian officials warned that continued US intervention could trigger further incidents in the global Oil and Gas sector, while Iran's Revolutionary Guard maintained that Tehran would continue asserting control over the strategic route.
The confrontation has pushed Oil prices higher and increased concerns that rising energy costs could keep global inflation elevated. This backdrop supports demand for the Greenback while limiting appetite for currencies linked to global growth, including the Aussie.
Investors will now turn their attention to Chinese trade and activity data, given Australia’s close economic relationship with China. China’s second-quarter Gross Domestic Product (GDP), out early Tuesday, is expected to expand 4.5% YoY, down from 5%, while quarterly growth is forecast to slow to 0.9% from 1.3%. Industrial Production is expected to improve slightly to 4.6%, while Retail Sales are projected to fall 0.1%, compared with the previous 0.6% decline.
On the US side, June Consumer Price Index (CPI) inflation on Tuesday is forecast to ease to 3.8% YoY from 4.2%, with the monthly reading expected to fall 0.1% after rising 0.5%. Core CPI is projected to remain unchanged at 2.9% YoY and 0.2% MoM.
Short-term technical analysis:
On the 4-hour chart, AUD/USD trades at 0.6934. The pair holds fractionally above the 100-period Simple Moving Average (SMA) at 0.6930 but remains capped by the 20-period SMA at 0.6940, leaving the near-term tone broadly neutral with a slight topside constraint. Horizontal resistance levels clustered just above price, together with a Relative Strength Index (RSI) hovering near 48, suggest consolidative conditions rather than a clear directional push for now.
On the topside, initial resistance is seen at the 20-period SMA around 0.6940, followed by the horizontal barriers at 0.6938 and 0.6944, with a stronger cap emerging near 0.6948. On the downside, immediate support is provided by the 100-period SMA at 0.6930, with the next horizontal floor near 0.6928, and a sustained break below this band would expose a deeper corrective phase within the broader consolidation.
(The technical analysis of this story was written with the help of an AI tool. Know more.)

- USD/CHF rises to its highest level since June 25 amid renewed tensions in the Middle East.
- The Swiss Franc underperforms as SNB intervention risks offset safe-haven demand.
- Traders turn their attention to Tuesday's US CPI report and Fed Chair Kevin Warsh's congressional testimony.
The Swiss Franc (CHF) weakens against the US Dollar (USD) on Monday as traders react to renewed hostilities in the Middle East. At the time of writing, USD/CHF trades around 0.8126, up 0.50% on the day and marking its highest level since June 25.
The pair advances despite modest strength in the US Dollar. The US Dollar Index (DXY), which tracks the Greenback’s value against a basket of six major currencies, trades around 101.13, up 0.17% on the day.
The United States (US) and Iran exchanged missile and drone attacks over the weekend, while Tehran claimed that it had once again closed the Strait of Hormuz, pushing Oil prices higher and fuelling inflation concerns.
While geopolitical uncertainty and expectations of a Federal Reserve (Fed) rate hike later this year keep the US Dollar supported, traders remain hesitant to push it higher ahead of Tuesday’s US Consumer Price Index (CPI) data and Fed Chair Kevin Warsh’s congressional testimony, which could offer fresh clues about the interest rate path.
The Swiss Franc has failed to attract sustained safe-haven demand despite heightened geopolitical uncertainty. The currency has depreciated by more than 5% against the US Dollar since the US-Iran war broke out in late February.
The Swiss Franc also faces pressure from the Swiss National Bank’s (SNB) increased willingness to intervene in the foreign exchange market to curb excessive appreciation. Foreign exchange transaction data published on June 30 showed that the SNB purchased CHF 3.94 billion worth of foreign currency in the first quarter of 2026.
Rabobank Senior FX Strategist Jane Foley noted, “Last week SNB President Schlegel repeated the warnings that the central bank was ready to intervene in the market if needed.”
Foley added, “For now, we expect that the SNB’s focus will remain on emphasising that FX intervention is a policy tool with the aim of dissuading speculative buying and preventing the CHF from appreciating.”
Swiss Franc Price Today
The table below shows the percentage change of Swiss Franc (CHF) against listed major currencies today. Swiss Franc was the strongest against the Japanese Yen.
| USD | EUR | GBP | JPY | CAD | AUD | NZD | CHF | |
|---|---|---|---|---|---|---|---|---|
| USD | 0.15% | 0.16% | 0.39% | -0.09% | 0.28% | -0.14% | 0.45% | |
| EUR | -0.15% | 0.02% | 0.26% | -0.24% | 0.14% | -0.25% | 0.31% | |
| GBP | -0.16% | -0.02% | 0.26% | -0.26% | 0.14% | -0.26% | 0.34% | |
| JPY | -0.39% | -0.26% | -0.26% | -0.50% | -0.12% | -0.51% | 0.10% | |
| CAD | 0.09% | 0.24% | 0.26% | 0.50% | 0.39% | 0.02% | 0.60% | |
| AUD | -0.28% | -0.14% | -0.14% | 0.12% | -0.39% | -0.35% | 0.24% | |
| NZD | 0.14% | 0.25% | 0.26% | 0.51% | -0.02% | 0.35% | 0.59% | |
| CHF | -0.45% | -0.31% | -0.34% | -0.10% | -0.60% | -0.24% | -0.59% |
The heat map shows percentage changes of major currencies against each other. The base currency is picked from the left column, while the quote currency is picked from the top row. For example, if you pick the Swiss Franc from the left column and move along the horizontal line to the US Dollar, the percentage change displayed in the box will represent CHF (base)/USD (quote).

