


Iran’s Foreign Ministry confirmed on Friday that a planned meeting in Switzerland with US officials had been postponed, adding that preparations are already underway for a new meeting in the coming days, Reuters reported. The ministry said that talks are on a final agreement, which would depend on the start and continued implementation of the specified terms included in a memorandum of understanding with the United States (US).
Iran also confirmed that the MOU with the US to end the war had been signed digitally, making Friday’s meeting in Switzerland no longer urgent. Late on Thursday, the White House announced that Vice President JD Vance delayed his trip to Switzerland to attend the talks, saying that the logistics had not been "simple or predictable."
For its part, the Swiss government said it remains ready to facilitate future discussions, while preparatory work for another meeting continues. The latest comments suggest that diplomatic efforts remain active, but Tehran wants the agreed terms to begin being implemented before moving toward a final agreement.
US Dollar Price Today
The table below shows the percentage change of US Dollar (USD) against listed major currencies today. US Dollar was the strongest against the Swiss Franc.
| USD | EUR | GBP | JPY | CAD | AUD | NZD | CHF | |
|---|---|---|---|---|---|---|---|---|
| USD | -0.10% | -0.16% | -0.13% | 0.27% | 0.00% | 0.30% | 0.37% | |
| EUR | 0.10% | -0.07% | 0.00% | 0.37% | 0.11% | 0.37% | 0.48% | |
| GBP | 0.16% | 0.07% | 0.06% | 0.43% | 0.19% | 0.46% | 0.55% | |
| JPY | 0.13% | 0.00% | -0.06% | 0.38% | 0.14% | 0.40% | 0.48% | |
| CAD | -0.27% | -0.37% | -0.43% | -0.38% | -0.22% | 0.02% | 0.10% | |
| AUD | -0.00% | -0.11% | -0.19% | -0.14% | 0.22% | 0.26% | 0.39% | |
| NZD | -0.30% | -0.37% | -0.46% | -0.40% | -0.02% | -0.26% | 0.08% | |
| CHF | -0.37% | -0.48% | -0.55% | -0.48% | -0.10% | -0.39% | -0.08% |
The heat map shows percentage changes of major currencies against each other. The base currency is picked from the left column, while the quote currency is picked from the top row. For example, if you pick the US Dollar from the left column and move along the horizontal line to the Japanese Yen, the percentage change displayed in the box will represent USD (base)/JPY (quote).
Nordea’s research suggests EUR/USD upside is constrained in coming months by interest rate differentials and relative growth. The European Central Bank is seen closer to the end of its hiking cycle than the Federal Reserve, while Eurozone data remain softer than US figures. Nordea still projects a modest EUR/USD recovery over the longer term as US exceptionalism fades.
Rate gap and growth weigh on Euro
"We see limited upside for EUR/USD in the near term, as the ECB is likely closer to the end of its hiking cycle than the Fed and growth in the euro area continues to lag behind the US."
"Our baseline is for EUR/USD to trade broadly sideways over the next few months, before gradually moving higher as US exceptionalism fades and the Fed eventually starts to cut rates ahead of the ECB."
"A break below recent lows in EUR/USD would open for a move towards the 1.03–1.05 area, while a sustained move above 1.10 would likely require a clear shift in relative data surprises in favour of the euro area or a dovish repricing of the Fed."
(This article was created with the help of an Artificial Intelligence tool and reviewed by an editor.)

- Gold heads for a third straight weekly loss as higher-for-longer Fed expectations weigh on sentiment.
- Traders price in a 70% chance of a September Fed rate hike following this week's hawkish FOMC meeting.
- Technically, XAU/USD remains below the Bollinger SMA middle band, while the RSI points to sustained bearish momentum.
Gold (XAU/USD) remains under pressure on Friday as traders assess the latest news about the US-Iran peace deal and the Federal Reserve's (Fed) hawkish monetary policy announcement. At the time of writing, XAU/USD trades around $4,150 after hitting a one-week low of $4,121 earlier in the day.
A modest pullback in the US Dollar (USD) is keeping downside contained, but the metal remains on track for its third straight weekly loss. Gold is down nearly 25% from its all-time high after the US-Iran war led traders to price out Fed rate-cut bets for this year, while the Fed's hawkish tilt further reinforced expectations that interest rates would remain higher for longer.
Traders now see a 70% chance that the US central bank could raise rates as soon as September, according to the CME FedWatch Tool. The shift toward tighter monetary policy comes after nearly half of FOMC members signaled at least one rate increase by year-end at the June meeting this week.
As a non-yielding asset, Gold tends to struggle in a high-interest-rate environment, as investors favor yield-bearing assets such as bonds.
The increasingly hawkish stance reflects a deteriorating inflation outlook, driven in part by the recent surge in Oil prices, which pushed annual inflation to 4.2% in May, well above the Fed's 2% target. Newly appointed Fed Chair Kevin Warsh reiterated that the central bank remains committed to bringing inflation back down to 2%.
Weak physical demand is adding to Gold's woes. According to sources cited by Indian media outlets, Gold imports into India, one of the world's largest bullion consumers, have fallen nearly 70% since the government raised import duties to 15% from 6% last month. However, Gold's longer-term outlook remains underpinned by steady central bank buying.
On the geopolitical front, the 60-day Memorandum of Understanding (MoU) between the United States and Iran has improved market sentiment.
The White House said US Vice President JD Vance had delayed a planned trip to Switzerland, where he was expected to lead a new round of talks with Iran. Iran's Foreign Ministry later said the MoU had already been signed digitally, making Friday's meeting in Switzerland no longer urgent. Meanwhile, Reuters reported Israel and Hezbollah agreed to a ceasefire, according to a senior US official.
Technical analysis: XAU/USD remains under pressure below the Bollinger mid-band
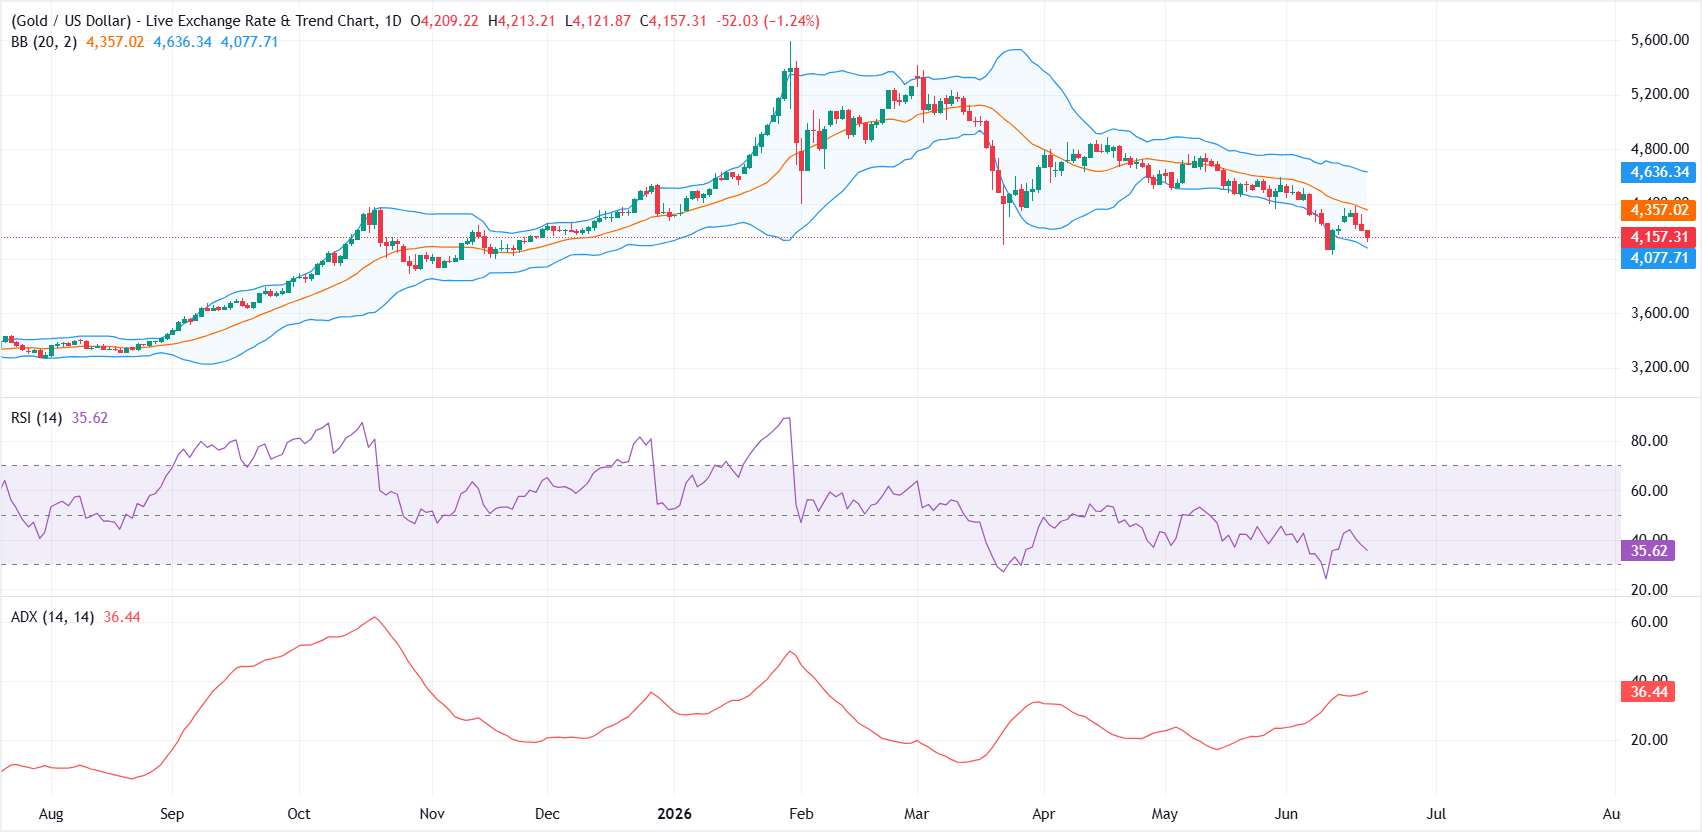
On the daily chart, XAU/USD extends its corrective slide below the Bollinger Simple Moving Average (SMA) middle band at $4,357. The metal holds closer to the lower half of the Bollinger envelope, while the Relative Strength Index (RSI) around 35 leans toward bearish momentum, and the Average Directional Index (ADX) in the mid‑30s suggests a strengthening downtrend bias.
On the topside, initial resistance emerges at the Bollinger SMA middle band near $4,356, with the upper Bollinger band coming in higher around $4,636 as a more distant cap if a rebound accelerates. On the downside, immediate support is seen near the recent base around $4,150, followed by the lower Bollinger band near $4,077, where sellers could hesitate before considering a deeper extension of the current pullback.
(The technical analysis of this story was written with the help of an AI tool.)
Gold FAQs
Gold has played a key role in human’s history as it has been widely used as a store of value and medium of exchange. Currently, apart from its shine and usage for jewelry, the precious metal is widely seen as a safe-haven asset, meaning that it is considered a good investment during turbulent times. Gold is also widely seen as a hedge against inflation and against depreciating currencies as it doesn’t rely on any specific issuer or government.
Central banks are the biggest Gold holders. In their aim to support their currencies in turbulent times, central banks tend to diversify their reserves and buy Gold to improve the perceived strength of the economy and the currency. High Gold reserves can be a source of trust for a country’s solvency. Central banks added 1,136 tonnes of Gold worth around $70 billion to their reserves in 2022, according to data from the World Gold Council. This is the highest yearly purchase since records began. Central banks from emerging economies such as China, India and Turkey are quickly increasing their Gold reserves.
Gold has an inverse correlation with the US Dollar and US Treasuries, which are both major reserve and safe-haven assets. When the Dollar depreciates, Gold tends to rise, enabling investors and central banks to diversify their assets in turbulent times. Gold is also inversely correlated with risk assets. A rally in the stock market tends to weaken Gold price, while sell-offs in riskier markets tend to favor the precious metal.
The price can move due to a wide range of factors. Geopolitical instability or fears of a deep recession can quickly make Gold price escalate due to its safe-haven status. As a yield-less asset, Gold tends to rise with lower interest rates, while higher cost of money usually weighs down on the yellow metal. Still, most moves depend on how the US Dollar (USD) behaves as the asset is priced in dollars (XAU/USD). A strong Dollar tends to keep the price of Gold controlled, whereas a weaker Dollar is likely to push Gold prices up.

Nordea expects USD/JPY to remain high as wide US–Japan yield differentials persist and the Bank of Japan stays very accommodative. While some gradual BoJ normalization is anticipated, it is seen as too modest to materially weaken the Japanese Yen near term. Nordea highlights intervention risk if USD/JPY rises excessively but does not base its forecast on it.
Wide rate gap underpins Japanese Yen weakness
"We expect USD/JPY to stay elevated as long as the Fed maintains its hawkish stance and US yields remain well above Japanese yields, while the BoJ only normalises policy very gradually."
"Even if the BoJ were to tweak its yield curve control framework further, we doubt that such steps would be sufficient on their own to trigger a sustained and significant strengthening of the JPY against the USD in the near term."
"Japanese authorities may step up verbal or even actual FX intervention if USD/JPY were to rise too quickly or move significantly above recent highs, but we do not base our central forecast on repeated large-scale interventions."
(This article was created with the help of an Artificial Intelligence tool and reviewed by an editor.)

Deutsche Bank’s Galina Pozdnyakova, Jim Reid and Luke Templeman highlight that next week’s main macro focus will be global flash PMIs and several key inflation releases. They note particular attention on the US May PCE report, alongside the Ifo survey in Germany, Tokyo CPI in Japan, and CPI reports in Canada and Australia.
Flash PMIs and global CPI releases
"The global flash PMIs will be amongst the main data highlights next week."
"In the US, the focus will also be on the May PCE report."
"Elsewhere, key releases include the Ifo survey in Germany, Tokyo CPI in Japan and CPI reports in Canada and Australia."
(This article was created with the help of an Artificial Intelligence tool and reviewed by an editor.)

Nordea analysts expect the Dollar to stay supported in coming months as the Federal Reserve maintains a relatively hawkish stance and US data remain firm. They argue that US growth and inflation dynamics justify higher yields versus peers, limiting Dollar downside. However, they still see a gradual Dollar depreciation over the medium term as global growth broadens and other central banks catch up.
Fed policy and data back Dollar strength
"In FX, we see the USD supported in the near term by relatively strong US data and a hawkish Fed, but we still expect a gradual depreciation over the medium term as growth outside the US improves and other central banks continue their hiking cycles."
"We expect the Fed to keep rates higher for longer than markets currently price, which should keep US yields elevated and support the dollar against most major currencies in the coming quarters."
"Risks to our USD view are two-sided, as a sharper-than-expected slowdown in US activity could trigger earlier Fed cuts and weigh on the dollar, while a renewed inflation surge or further upside surprises in US data could extend the period of dollar strength."
(This article was created with the help of an Artificial Intelligence tool and reviewed by an editor.)

- USD/CAD rises to its highest level since April 2025 as weak Canadian Retail Sales and lower Oil prices weigh on the Loonie.
- The Canadian Dollar faces another headwind from diverging Fed and BoC monetary policy outlooks.
- Markets price in a 70% chance of a Fed rate hike in September, according to CME FedWatch data.
USD/CAD trades on the front foot on Friday despite a modest pullback in the US Dollar (USD), as weaker-than-expected Canadian Retail Sales data weighs on the Canadian Dollar (CAD). At the time of writing, the pair trades around 1.4170, its highest level since April 2025.
Statistics Canada reported on Friday that Retail Sales rose 0.5% in April, down from a 0.9% increase in March and slightly below the 0.6% consensus forecast. Retail Sales excluding automobiles increased just 0.1%, missing forecasts of 0.7%, while March's reading was revised down to 1.2% from 1.4%.
The CAD is also facing pressure from diverging monetary policy outlooks between the Bank of Canada (BoC) and the Federal Reserve (Fed). At this week's policy meeting, the Fed reiterated its commitment to returning inflation to its 2% target, while nine of 19 policymakers projected at least one rate hike this year.
The hawkish tilt comes as higher Oil prices have pushed US inflation higher, with May Consumer Price Index (CPI) accelerating to 4.2%, its highest level since April 2023.
Following the meeting, markets priced in 70% chance of a September rate hike, according to CME FedWatch data, providing fresh support for the Greenback. The US Dollar Index (DXY), which tracks the Greenback's value against a basket of six major currencies, trades around 100.81 after touching 101.13 earlier in the day, its highest level since May 2025.
By contrast, inflation pressures in Canada remain relatively contained. At last week's meeting, the Bank of Canada (BoC) said US tariffs argue for lower rates, although persistently high energy prices could justify "consecutive increases in the policy rate."
However, with Oil prices retreating following the US-Iran truce, the case for rate hikes has weakened. Lower crude prices are also adding pressure on the commodity-linked Loonie, given Canada's status as a major Oil exporter. West Texas Intermediate (WTI) Crude trades around $75.50 per barrel, its lowest level since March 5.
Canadian Dollar Price Today
The table below shows the percentage change of Canadian Dollar (CAD) against listed major currencies today. Canadian Dollar was the strongest against the Swiss Franc.
| USD | EUR | GBP | JPY | CAD | AUD | NZD | CHF | |
|---|---|---|---|---|---|---|---|---|
| USD | -0.05% | -0.09% | -0.05% | 0.23% | 0.01% | 0.33% | 0.37% | |
| EUR | 0.05% | -0.04% | 0.00% | 0.29% | 0.07% | 0.37% | 0.42% | |
| GBP | 0.09% | 0.04% | 0.04% | 0.32% | 0.13% | 0.43% | 0.47% | |
| JPY | 0.05% | 0.00% | -0.04% | 0.28% | 0.09% | 0.37% | 0.41% | |
| CAD | -0.23% | -0.29% | -0.32% | -0.28% | -0.17% | 0.09% | 0.13% | |
| AUD | -0.01% | -0.07% | -0.13% | -0.09% | 0.17% | 0.29% | 0.35% | |
| NZD | -0.33% | -0.37% | -0.43% | -0.37% | -0.09% | -0.29% | 0.03% | |
| CHF | -0.37% | -0.42% | -0.47% | -0.41% | -0.13% | -0.35% | -0.03% |
The heat map shows percentage changes of major currencies against each other. The base currency is picked from the left column, while the quote currency is picked from the top row. For example, if you pick the Canadian Dollar from the left column and move along the horizontal line to the US Dollar, the percentage change displayed in the box will represent CAD (base)/USD (quote).

- Silver posts a third consecutive daily decline and remains on track for a notable weekly loss.
- Markets continue to strengthen expectations for higher US interest rates following the Fed’s latest meeting.
- Optimism surrounding a ceasefire between Israel and Hezbollah limits demand for safe-haven assets.
Silver (XAG/USD) trades around $64.85 on Friday at the time of writing, down 1.31% on the day. The white metal remains under pressure for a third consecutive day as investors reassess the outlook for US monetary policy and developments in the Middle East.
Market sentiment continues to be influenced by the hawkish tone adopted by the Federal Reserve (Fed) this week. At its June meeting, the US central bank left interest rates unchanged but signaled that several policymakers still support an additional rate hike before year-end. This stance has led traders to reinforce expectations for higher interest rates for longer, reducing the appeal of non-yielding assets such as Silver.
According to the CME FedWatch tool, markets are now assigning a high chance to a rate hike in the coming months. Newly appointed Fed Chair Kevin Warsh also reiterated the central bank’s commitment to returning inflation to its 2% target, adding to expectations of a more restrictive monetary policy stance.
On the geopolitical front, the traditional safe-haven support for precious metals has weakened after Reuters reported that Israel and Hezbollah agreed to a ceasefire starting Friday afternoon. The development has helped improve risk appetite and reduced defensive demand for Silver.
Inflation concerns also remain in focus due to volatility in energy prices and risks surrounding global Oil supply. However, these factors have not been sufficient to offset the negative impact of expectations for tighter US monetary policy.
Silver, therefore, remains biased to the downside in the near term, with investors closely monitoring upcoming US economic data and any signals that could either confirm or challenge expectations of further Federal Reserve tightening.
Silver FAQs
Silver is a precious metal highly traded among investors. It has been historically used as a store of value and a medium of exchange. Although less popular than Gold, traders may turn to Silver to diversify their investment portfolio, for its intrinsic value or as a potential hedge during high-inflation periods. Investors can buy physical Silver, in coins or in bars, or trade it through vehicles such as Exchange Traded Funds, which track its price on international markets.
Silver prices can move due to a wide range of factors. Geopolitical instability or fears of a deep recession can make Silver price escalate due to its safe-haven status, although to a lesser extent than Gold's. As a yieldless asset, Silver tends to rise with lower interest rates. Its moves also depend on how the US Dollar (USD) behaves as the asset is priced in dollars (XAG/USD). A strong Dollar tends to keep the price of Silver at bay, whereas a weaker Dollar is likely to propel prices up. Other factors such as investment demand, mining supply – Silver is much more abundant than Gold – and recycling rates can also affect prices.
Silver is widely used in industry, particularly in sectors such as electronics or solar energy, as it has one of the highest electric conductivity of all metals – more than Copper and Gold. A surge in demand can increase prices, while a decline tends to lower them. Dynamics in the US, Chinese and Indian economies can also contribute to price swings: for the US and particularly China, their big industrial sectors use Silver in various processes; in India, consumers’ demand for the precious metal for jewellery also plays a key role in setting prices.
Silver prices tend to follow Gold's moves. When Gold prices rise, Silver typically follows suit, as their status as safe-haven assets is similar. The Gold/Silver ratio, which shows the number of ounces of Silver needed to equal the value of one ounce of Gold, may help to determine the relative valuation between both metals. Some investors may consider a high ratio as an indicator that Silver is undervalued, or Gold is overvalued. On the contrary, a low ratio might suggest that Gold is undervalued relative to Silver.

ING’s Francesco Pesole highlights that Andy Burnham’s by-election win paves his way to become UK Prime Minister, with betting markets expecting a transition by late summer. The absence of a political risk premium in Pound assets suggests investors see limited fiscal disruption. ING maintains a generally bullish stance on EUR/GBP, citing no further Bank of England hikes while flagging fiscal headlines as an upside risk.
Burnham path to power and Pound pricing
"In the coming days, we might already see some cabinet resignations aimed at pressuring PM Keir Starmer to step down and speed up a transition to Burnham. The alternative is a lengthier leadership challenge. Anyway, betting markets – and likely the investor community – have a very high conviction that Burnham will become PM by the end of the summer."
"The lack of any political risk premium in the pound over the past month suggests markets have grown increasingly assured that Burnham won’t upset the gilt market with his fiscal plans. Still, the bar has been low since 2022 for GBP and gilts to react negatively to fiscal headlines, and we are adding that as an upside risk in our generally bullish view on EUR/GBP. Still, our view rests primarily on our call for no Bank of England hikes, with yesterday’s rather uneventful meeting reinforcing our conviction."
(This article was created with the help of an Artificial Intelligence tool and reviewed by an editor.)

Citing a senior US official on Friday, Reuters reported that Israel and Hezbollah have agreed to a ceasefire at 4 p.m. local time on Friday.
"We understand that after the exchange of fire earlier today, Israel and Hezbollah are now in a ceasefire," the official said and explained that negotiators for the US and Qataris worked out the deal with help from Iran.
Market reaction
The US Dollar Index inched slightly lower with the immediate reaction to this headline and it was last seen losing 0.05% on the day at 100.75.

