Moving Average (Moving Average, MA) is a technical indicator to calculate the averages of a market’s movements over a longer time period. It identifies overall trend of price, and forecasts upcoming trends.
It's one of the most common indicators given its simplicity.
How does Moving Average work?
Moving Average(MA) represents the average closing price over a certain period of time. It's commonly used to identify trend directions, to know when markets are overbought and oversold relative to the average price of currency pairs. Typically oversold zones offer traders the opportunity to buy, and overbought zones offer an opportunity to sell.
For example, if EUR/USD is trading below its 50-day moving average on the daily chart, it can be assumed it's is in a bearish phase. If trading above the 50-day moving average, it could be in bullish momentum.
The 50-day Moving Average is a commonly used among traders, and the 200-day Moving Average is also considered to be a solid indicator of market trend reversals.
Moving Average on the chart
1
Determine price trends
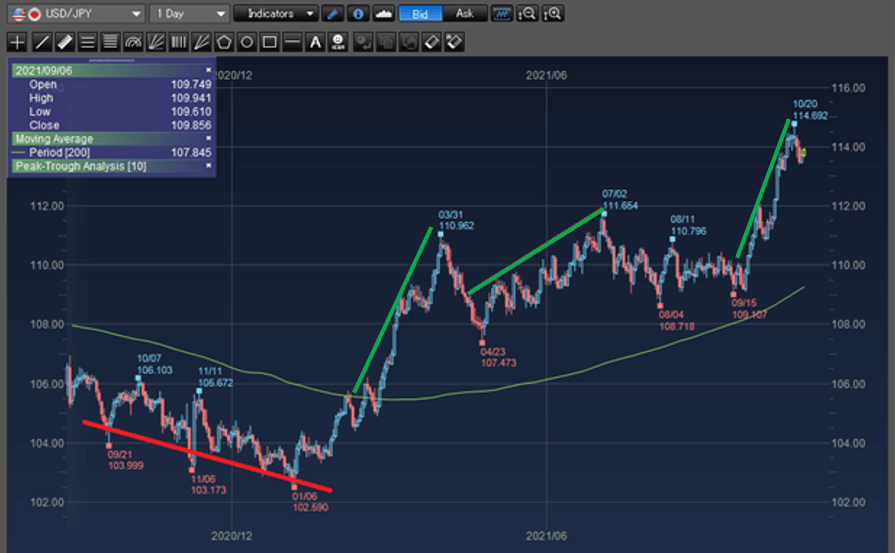
As shown in the USD/JPY Price Chart below, price is below the 200-day moving average at the beginning and creates an downward trend.
When the USD/JPY price approached the 200-day moving average, there is a possibility of a turning trend. In below chart, upward trend started after the price hit the 200-day moving average.
2
Determine entry signals (Golden Cross, Death Cross)
Crossing of two moving averages with different timeline is commonly used to find buy and sell entry signals.
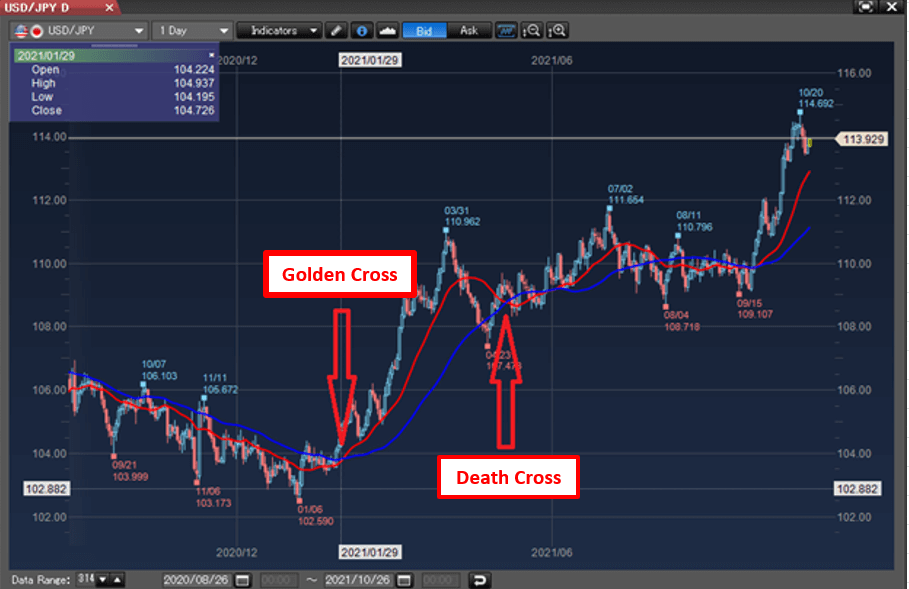
Golden Cross When the shorter period average (the fast lane) rises over the longer period average (the slow lane), the recent trend is breaking the long-term trend and creates the buy signal.
Death Cross When the shorter period(the fast lane) drops below the longer period (the slow lane), the recent trend is breaking the long-term trend and creates the sell signal.
Below is an example of Gold Cross and Death Cross using 20-day moving average (red line) as the fast line, and a 50-day average (blue line) as the slow line in the price chart.
Relative Strength Index (RSI)
Relative Strength Index (RSI), is an indicator to estimate the momentum of buyers and sellers, to measure the magnitude of price changes, and determine whether the market is overbought or oversold.
How does RSI work?
RSI is calculated by average gain and average loss during the period, and displayed as an oscillator (a line graph) on a scale of 0 to 100.
Traditionally, an RSI reading of 70 or above indicates an overbought situation and 30 or below indicates an oversold condition.
RSI on the chart
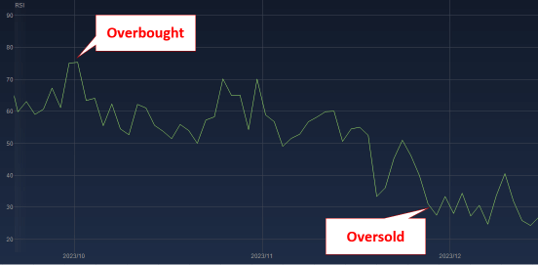
In below chart, RSI was above 70 on October 2023, which typically indicate overbought conditions. Some traders expect the rising trend is likely to reverse, which means it’s an opportunity to sell.
RSI went below 30 on November 2023, which typically indicates oversold market conditions. Some traders expect that the falling trend is likely to reverse, which means it’s an opportunity to buy.
Bollinger Bands
Bollinger bands is a technical analysis tool that consists of a simple moving average (SMA) line and two standard deviation lines that are plotted above and below a simple moving average line.
It helps traders to gauge market volatility, identify potential trends, and generate trading signals. Bollinger Bands were created by John Bollinger in the 1980s.
How does Bollinger Bands work?
Bollinger bands use 2 parameters, Period and Standard Deviations. The default values are 20 for period, and 2 for standard deviation. It works by plotting two standard deviations away from a simple moving average (SMA).
A. An upper band is the middle band plus two standard deviations.
B. A middle band is the average price over a specific period.
C. A lower band is the middle band minus two standard deviations.
During normal market conditions, the bands usually appear to move together. However, it will change during periods of high or low volatility. If the distance between the bands is tight, it indicates low volatility in the market. If the distance between the bands is wide, volatility increases, and any existing trend may be changed.
Bollinger bands on the chart
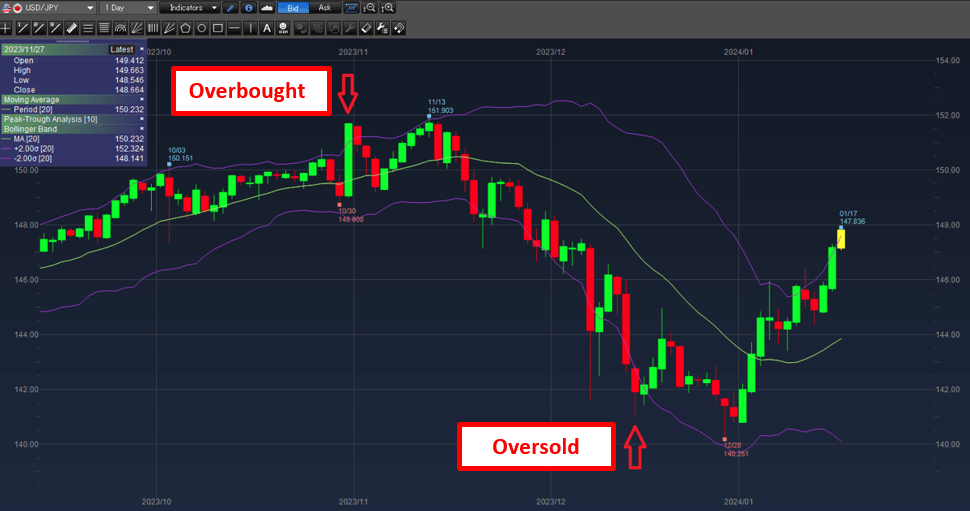
Bollinger bands change based on real-time price movements, traders use the bands to generate overbought or oversold signals and to clarify price patterns.
Overbought signals
When price action is close to the upper band, the current price of the asset is considered high relative to recent prices, when price touches or breaks above the upper band, traders consider it to be overbought.
Oversold signals
When price moves close to the lower band, the current price is considered low relative to recent prices. When the price of the asset touches or breaks below the lower band of the Bollinger Bands, traders consider it to be oversold.
Fibonacci Retracement
Fibonacci Retracement is a tool that can help to find possible support and resistance levels in the trending market, as well as where to place stop-loss and take-profit orders, from the identified peak and trough.
How does Fibonacci Retracement work?
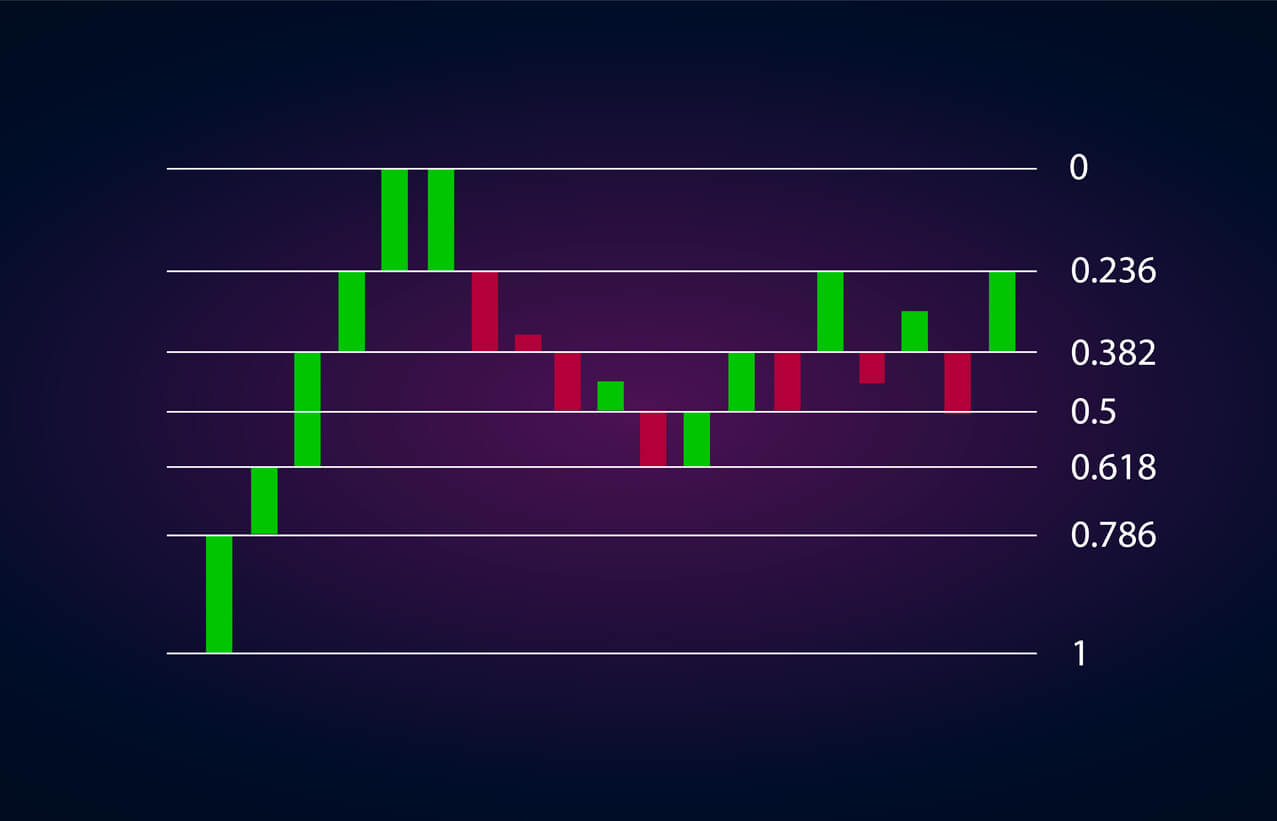
Fibonacci retracement levels are usually calculated and drawn as certain ratios (0%, 38.2%, 50% 61.8% and 100%) from vertical distance of a pair of identified peak and trough in the price chart.
It is called Fibonacci retracement because golden ratios (like 38.2% and 61.8%) are derived from a sequence of numbers called the Fibonacci’s sequence and are usually applied to detect the retracement levels of a certain trend.
Fibonacci Retracement on the chart
1
Identify a trend
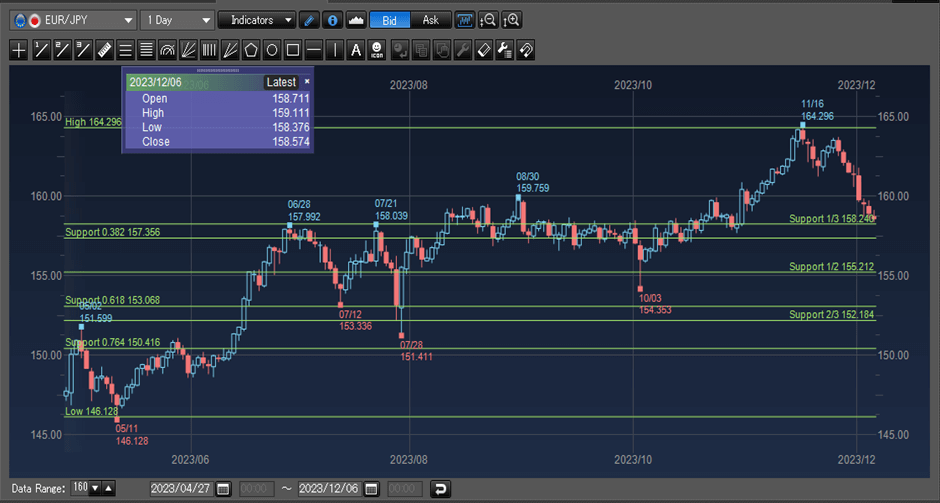
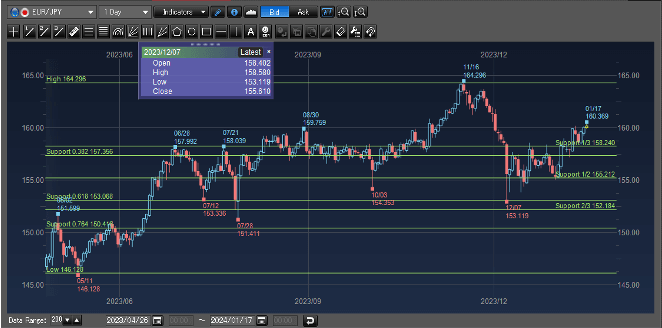
For example, in the EUR/JPY daily chart below, there was an uptrend from 146.128 to 164.296. The price then started to go down.
2
Decide which level is a good support and take-profit when target price reached
Assume traders believed EUR/JPY would go up again after some rebound, to decide where to place a buy order, traders could use Fibonacci retracement as the reference support levels. In this case the price went down to around 61.8% retracement level (153.068) of the identified trend and goes up again. If traders think the price would at least go back to 38.2% resistance level, a take-profit order could be placed at around 157.356.
3
Stop-loss when things are not going right
On the other hand, to better control risk, traders are advised to prepare for potential trend direction change. In this case a stop-loss order could be placed below the 61.8% support level to close the existing buy EUR/JPY position to limit your loss in case EUR/JPY price went down further.
(In Rakuten FX platform, both the peak and the trough shown in the chosen time frame will automatically be used as the peak and trough of the trend when we add Fibonacci retracement as the indicator. Traders could either change the time/data range shown in the chart to pick the desired peak and trough of a trend.)