


ING’s Chris Turner notes that despite sizeable joint FX intervention in USD/JPY and lower Oil prices, the US Dollar (USD) is not broadly weaker as markets still price a Federal Reserve (Fed) hike in September. He highlights upcoming US jobs data and ISM manufacturing as key inputs, and sees the US Dollar Index (DXY) finding support near 99.35/40 and potentially breaking back above 100 this week.
DXY holds as markets eye Fed
"In theory, the dollar should be broadly weaker today after the US and Japanese authorities confirmed joint FX intervention and the Japanese probably sold $70-80bn over the last three days. Lower oil prices should also be weighing on the dollar on reports from US President Donald Trump that negotiation, rather than military firepower, is Washington's preferred method of engaging with Iran."
"The fact that the dollar is not broadly weaker probably owes to the unresolved issue of whether the Federal Reserve will hike in September. "
"For today, the focus should be on a reasonably strong July ISM manufacturing release."
"It seems the only way the Fed can avoid hiking in September is if the US data is poor enough. A major input to that decision comes this week in the form of US jobs data, including JOLTS job openings, ADP, and Friday's non-farm payrolls report. On NFP, consensus is around +75-80k and probably not quite weak enough to rule out a Fed hike. In other words, the case for a sustained sell-off in the dollar has yet to be made."
"The DXY dollar index will be bounced around by the USD/JPY intervention story, but with decreasing marginal impact from this news story, we suspect DXY could find support near 99.35/40 and can break back above 100 this week."
(This article was created with the help of an Artificial Intelligence tool and reviewed by an editor. Know more.)

- AUD/USD struggles to capitalize on a modest bullish gap opening to a fresh high since June 17.
- A goodish USD recovery from a one-and-a-half-month low exerts downward pressure on the pair.
- The setup favors bulls and supports prospects for the emergence of dip-buying at lower levels.
The AUD/USD pair faces rejection near the 100-day Simple Moving Average (SMA) and retreats slightly after hitting a fresh high since June 17, around the 0.7050 level earlier this Monday. Spot prices slide to the 0.7030-0.7025 region heading into the European session, though the downside potential seems limited amid a supportive fundamental and technical setup.
The US Dollar (USD) stages a goodish recovery from a one-and-a-half-month low, which, along with the disappointing release of China's RatingDog Manufacturing PMI, exerts some pressure on the AUD/USD pair. However, renewed hopes for a US-Iran peace deal and receding US Federal Reserve (Fed) rate hike bets, amid easing inflation fears on the back of a steep decline in oil prices, should cap the USD and help limit the downside for the currency pair.
From a technical perspective, last week's breakout through the 0.7020 barrier, representing the 38.2% Fibonacci retracement level of the May-June downfall, was seen as a key trigger for AUD/USD bulls. Moreover, momentum indicators remain supportive. In fact, the Relative Strength Index is hovering around 57, and the Moving Average Convergence Divergence (MACD) is slightly positive, hinting that buyers still control the short-term bias while facing nearby resistance.
However, the 100-day SMA at 0.7053, followed by the 50.0% retracement at 0.7069, might continue to act as immediate hurdles. A daily close above this cluster would open the way toward the 61.8% retracement at 0.7117 and then 0.7184, ahead of the cycle high near 0.7271.
On the downside, initial support aligns with the 38.2% retracement at 0.7021, with additional layers at 0.6962 and the 200-day SMA at 0.6913, while a deeper retreat would expose the structural floor around 0.6867.
AUD/USD daily chart
Australian Dollar FAQs
One of the most significant factors for the Australian Dollar (AUD) is the level of interest rates set by the Reserve Bank of Australia (RBA). Because Australia is a resource-rich country another key driver is the price of its biggest export, Iron Ore. The health of the Chinese economy, its largest trading partner, is a factor, as well as inflation in Australia, its growth rate and Trade Balance. Market sentiment – whether investors are taking on more risky assets (risk-on) or seeking safe-havens (risk-off) – is also a factor, with risk-on positive for AUD.
The Reserve Bank of Australia (RBA) influences the Australian Dollar (AUD) by setting the level of interest rates that Australian banks can lend to each other. This influences the level of interest rates in the economy as a whole. The main goal of the RBA is to maintain a stable inflation rate of 2-3% by adjusting interest rates up or down. Relatively high interest rates compared to other major central banks support the AUD, and the opposite for relatively low. The RBA can also use quantitative easing and tightening to influence credit conditions, with the former AUD-negative and the latter AUD-positive.
China is Australia’s largest trading partner so the health of the Chinese economy is a major influence on the value of the Australian Dollar (AUD). When the Chinese economy is doing well it purchases more raw materials, goods and services from Australia, lifting demand for the AUD, and pushing up its value. The opposite is the case when the Chinese economy is not growing as fast as expected. Positive or negative surprises in Chinese growth data, therefore, often have a direct impact on the Australian Dollar and its pairs.
Iron Ore is Australia’s largest export, accounting for $118 billion a year according to data from 2021, with China as its primary destination. The price of Iron Ore, therefore, can be a driver of the Australian Dollar. Generally, if the price of Iron Ore rises, AUD also goes up, as aggregate demand for the currency increases. The opposite is the case if the price of Iron Ore falls. Higher Iron Ore prices also tend to result in a greater likelihood of a positive Trade Balance for Australia, which is also positive of the AUD.
The Trade Balance, which is the difference between what a country earns from its exports versus what it pays for its imports, is another factor that can influence the value of the Australian Dollar. If Australia produces highly sought after exports, then its currency will gain in value purely from the surplus demand created from foreign buyers seeking to purchase its exports versus what it spends to purchase imports. Therefore, a positive net Trade Balance strengthens the AUD, with the opposite effect if the Trade Balance is negative.
(The technical analysis of this story was written with the help of an AI tool. Know more.)

Danske Research Team notes that equity indices have been broadly unchanged over the summer, but sector rotations have been significant. Higher Oil prices supported energy stocks, while within technology, software has outperformed and semiconductors have lagged. Regional equity performance has mirrored these dynamics, with Emerging Markets weaker and Norway, Europe and Sweden showing relative strength.
Rotations drive sector and regional moves
"Equity indices have been broadly unchanged over the summer, but beneath the surface the rotations have been substantial. Higher oil prices naturally supported energy stocks, but equally important has been another significant rotation within the technology sector."
"Unlike earlier this year, software has materially outperformed while semiconductors have lagged. This has not reflected disappointing earnings. Instead, investor attention has again centred around the uncertainty surrounding the longer-term AI capital expenditure cycle."
"Regional equity performance has mirrored these sector dynamics. Emerging Markets have underperformed while Norway has benefited from higher energy prices."
"Interestingly, both Europe and Sweden have delivered relative outperformance throughout the geopolitical escalation, a notable contrast to previous episodes earlier this year."
"This morning sentiment is improving once again as lower oil prices support risk appetite. South Korea is the notable exception with equities down around 6%, while both US and European futures indicate another opening close to fresh all-time highs."
(This article was created with the help of an Artificial Intelligence tool and reviewed by an editor. Know more.)
- The Swiss Franc weakens against the US Dollar amid firm Fed interest rate hike expectations.
- The US and Iran announce ceasefire 2.0 as Tehran agrees to Hormuz reopening and nuclear terms.
- Investors await the US NFP data for fresh cues regarding the Fed's monetary policy outlook.
The Swiss Franc (CHF) trades lower against its major currency peers at the start of the week. The USD/CHF pair rises 0.15% to near 0.8082 as a market-sentiment revival following the announcement of a ceasefire in the Middle East has diminished the appeal of safe-haven assets.
Swiss Franc Price Today
The table below shows the percentage change of Swiss Franc (CHF) against listed major currencies today. Swiss Franc was the weakest against the Japanese Yen.
| USD | EUR | GBP | JPY | CAD | AUD | NZD | CHF | |
|---|---|---|---|---|---|---|---|---|
| USD | -0.01% | 0.13% | -0.47% | 0.09% | -0.13% | -0.08% | 0.17% | |
| EUR | 0.01% | 0.13% | -0.51% | 0.10% | -0.14% | -0.03% | 0.15% | |
| GBP | -0.13% | -0.13% | -0.59% | -0.06% | -0.26% | -0.16% | 0.04% | |
| JPY | 0.47% | 0.51% | 0.59% | 0.51% | 0.27% | 0.40% | 0.55% | |
| CAD | -0.09% | -0.10% | 0.06% | -0.51% | -0.23% | -0.11% | 0.03% | |
| AUD | 0.13% | 0.14% | 0.26% | -0.27% | 0.23% | 0.10% | 0.29% | |
| NZD | 0.08% | 0.03% | 0.16% | -0.40% | 0.11% | -0.10% | 0.21% | |
| CHF | -0.17% | -0.15% | -0.04% | -0.55% | -0.03% | -0.29% | -0.21% |
The heat map shows percentage changes of major currencies against each other. The base currency is picked from the left column, while the quote currency is picked from the top row. For example, if you pick the Swiss Franc from the left column and move along the horizontal line to the US Dollar, the percentage change displayed in the box will represent CHF (base)/USD (quote).
Over the weekend, United States (US) President Donald Trump shelved planned attacks on Iran, clarifying that Tehran agreed to the nuclear deal and the reopening of the Strait of Hormuz.
At press time, S&P 500 futures are 0.6% higher to near 7,535, reflecting a risk-on mood. The US Dollar Index (DXY), which tracks the Greenback’s value against six major currencies, trades 0.1% lower to near 99.70.
Though the US Dollar Index is also down, it is trading higher against the Swiss Franc amid expectations that the Federal Reserve (Fed) will raise interest rates in the near term.
According to TD Securities, the strength of underlying US activity is increasingly calling into question how tight current Fed policy actually is, with the bank noting that “robust activity is also another sign that policy may not be that restrictive.” At the same time, TD Securities cautions that inflation dynamics remain critical: “If core services inflation continues to prove sticky, that would likely be enough to motivate the Fed to tighten policy,” its analysts warn, highlighting the risk that persistent price pressures in the services sector could still force additional action from the central bank.
Meanwhile, the CME FedWatch tool shows a 64.6% chance that the Fed will raise interest rates in the September policy meeting.
This week, investors will focus on a string of US economic data, notably the Nonfarm Payrolls (NFP) data for July, which will be released on Friday.
Fed FAQs
Monetary policy in the US is shaped by the Federal Reserve (Fed). The Fed has two mandates: to achieve price stability and foster full employment. Its primary tool to achieve these goals is by adjusting interest rates. When prices are rising too quickly and inflation is above the Fed’s 2% target, it raises interest rates, increasing borrowing costs throughout the economy. This results in a stronger US Dollar (USD) as it makes the US a more attractive place for international investors to park their money. When inflation falls below 2% or the Unemployment Rate is too high, the Fed may lower interest rates to encourage borrowing, which weighs on the Greenback.
The Federal Reserve (Fed) holds eight policy meetings a year, where the Federal Open Market Committee (FOMC) assesses economic conditions and makes monetary policy decisions. The FOMC is attended by twelve Fed officials – the seven members of the Board of Governors, the president of the Federal Reserve Bank of New York, and four of the remaining eleven regional Reserve Bank presidents, who serve one-year terms on a rotating basis.
In extreme situations, the Federal Reserve may resort to a policy named Quantitative Easing (QE). QE is the process by which the Fed substantially increases the flow of credit in a stuck financial system. It is a non-standard policy measure used during crises or when inflation is extremely low. It was the Fed’s weapon of choice during the Great Financial Crisis in 2008. It involves the Fed printing more Dollars and using them to buy high grade bonds from financial institutions. QE usually weakens the US Dollar.
Quantitative tightening (QT) is the reverse process of QE, whereby the Federal Reserve stops buying bonds from financial institutions and does not reinvest the principal from the bonds it holds maturing, to purchase new bonds. It is usually positive for the value of the US Dollar.

- The Indian Rupee starts the week on a strong note against the US Dollar due to multiple tailwinds.
- US President Trump halts attacks on Iran as it agrees to the nuclear deal and the Hormuz reopening.
- Investors await the RBI’s policy, which will be announced on Wednesday.
The Indian Rupee (INR) opens strongly against the US Dollar (USD) at the start of the week. The USD/INR extends its losing streak for the third trading day, is down 0.25% to near 95.15, the lowest level seen in over three weeks.
The Indian currency is strengthening as the announcement of a ceasefire between the United States (US) and Iran after renewed hostilities in the Middle East in July has pushed oil prices sharply lower.
In the opening trade, the MCX Crude Oil contract expiring on August 19 trades over 6% lower to near Rs. 7,600.
Currencies from economies, such as India, which rely heavily on oil imports to meet their energy needs, tend to underperform in a high oil price environment.
US halts planned attacks on Iran
Over the weekend, US President Donald Trump announced that planned attacks on Iran have been suspended as the nation has agreed to the nuclear deal and the reopening of the Strait of Hormuz, a vital passage for almost 20% of the global energy supply.
“We have just been asked by Iran, and other Middle Eastern Countries, to hold off any attack in that the perimeters of a deal has been agreed to. This would include the Immediate, Complete, and Total OPENING OF THE HORMUZ STRAIT, and an end to Iran’s nuclear threat,” Trump wrote on Truth Social.
The renewed US-Iran peace hopes appear to have given a lifeline to Indian stock markets. At press time, the Nifty50 Index is up 0.7% at around 24,555.
RBI policy awaited
On the domestic front, the major event for the Indian currency this week will be the Reserve Bank of India’s (RBI) monetary policy announcement on Wednesday.
Economists at ING expect the Reserve Bank of India to leave the policy stance unchanged at its upcoming meeting, stating that “we expect the Reserve Bank of India to keep the repo rate unchanged at 5.25% on Wednesday.” They acknowledge that “headline inflation surprised to the upside in June, largely due to higher fuel prices,” but stress that “underlying price pressures remain contained.” In their view, “core inflation continues to run below the RBI's target, providing policymakers with sufficient room to keep policy rates unchanged while monitoring evolving risks to the inflation outlook.”
US Dollar drops despite firm Fed interest rate hike prospects
The US Dollar Index (DXY) continues last week’s underperformance, trading 0.1% lower at around 99.70 in the Asian session. The Greenback faces pressure even as traders are confident that the Federal Reserve (Fed) will deliver an interest rate hike at the September policy meeting.
According to the CME FedWatch tool, the odds of the Fed hiking interest rates next month are 67.7%.
This week, investors will focus on a slew of US economic data, especially the US Nonfarm Payrolls (NFP) data for July, which will be released on Friday. Later in the day, investors will focus on the US ISM Manufacturing PMI data for July. The Manufacturing PMI is expected to arrive at 54.0, up from 53.3 in June.
Technical Analysis: USD/INR stabilizes below 20-day EMA
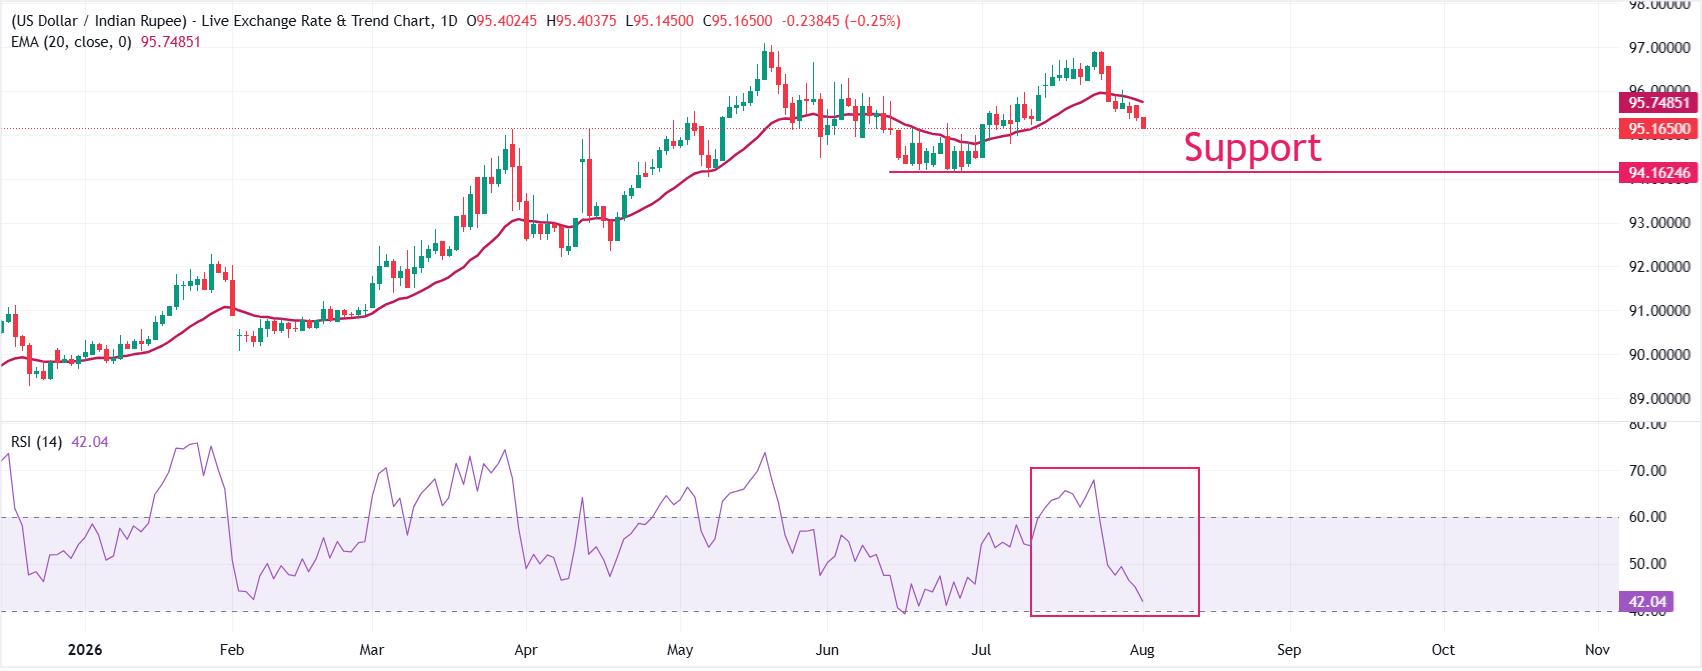
USD/INR trades lower at 95.15, keeping a bearish near-term tone as it holds below the 20-day exponential moving average (EMA) at 95.75. The EMA overhead suggests rallies remain capped for now, while the Relative Strength Index (RSI) at 42 stays below the neutral 50 line, hinting at lingering downside pressure rather than a decisive oversold condition.
On the topside, initial resistance is defined by the 20-day EMA clustered near 95.75, and a daily close above this barrier would be needed to ease the current bearish bias and open the way for a stronger recovery. On the downside, the July 7 low at 94.78 is the key support level, followed by the June 26 low at 94.15.
(The technical analysis of this story was written with the help of an AI tool. Know more.)
Economic Indicator
RBI Interest Rate Decision (Repo Rate)
The RBI Interest Rate Decision is announced by the Reserve Bank of India. If the bank is hawkish about the inflationary outlook of the economy and rises the interest rates, it is seen as positive, or bullish, for the INR, while a dovish outlook for the economy (or a rate cut) is seen as negative, or bearish, for the currency.
Read more.Next release: Wed Aug 05, 2026 04:30
Frequency: Irregular
Consensus: 5.25%
Previous: 5.25%
Source: Reserve Bank of India

Here is what you need to know on Monday, August 3:
Market mood improves at the beginning of the new week as the United States (US) and Iran revive efforts for a diplomatic solution to the conflict. In the second half of the day, the Institute for Supply Management's (ISM) Manufacturing Purchasing Managers' Index (PMI) data for July will be featured in the US economic calendar.
US Dollar Price Last 7 Days
The table below shows the percentage change of US Dollar (USD) against listed major currencies last 7 days. US Dollar was the weakest against the Japanese Yen.
| USD | EUR | GBP | JPY | CAD | AUD | NZD | CHF | |
|---|---|---|---|---|---|---|---|---|
| USD | -1.13% | -0.93% | -4.20% | -0.35% | -0.39% | -1.23% | -0.84% | |
| EUR | 1.13% | 0.19% | -3.11% | 0.78% | 0.76% | -0.10% | 0.29% | |
| GBP | 0.93% | -0.19% | -3.40% | 0.60% | 0.57% | -0.28% | 0.10% | |
| JPY | 4.20% | 3.11% | 3.40% | 4.00% | 3.96% | 3.09% | 3.40% | |
| CAD | 0.35% | -0.78% | -0.60% | -4.00% | -0.07% | -0.88% | -0.50% | |
| AUD | 0.39% | -0.76% | -0.57% | -3.96% | 0.07% | -0.84% | -0.46% | |
| NZD | 1.23% | 0.10% | 0.28% | -3.09% | 0.88% | 0.84% | 0.38% | |
| CHF | 0.84% | -0.29% | -0.10% | -3.40% | 0.50% | 0.46% | -0.38% |
The heat map shows percentage changes of major currencies against each other. The base currency is picked from the left column, while the quote currency is picked from the top row. For example, if you pick the US Dollar from the left column and move along the horizontal line to the Japanese Yen, the percentage change displayed in the box will represent USD (base)/JPY (quote).
US President Donald Trump announced over the weekend that he held off a planned "massive attack" and said a day later that negotiations with Iran will resume on Monday. Iranian President Masoud Pezeshkian urged the US to “remain committed” to the Memorandum of Understanding (MoU) signed in June.
Crude Oil prices opened with a huge bearish gap on this development and the barrel of West Texas Intermediate was last seen trading at around $78, losing more than 8% on the day. Reflecting the upbeat market mood, the US Dollar (USD) Index stays below 100.00 after losing more than 1.5% in the previous week and US stock index futures are up between 0.5% and 0.8% on the day.
Brent retreats as US-Iran talks resume after aborted strike
Analysts at Danske Bank highlight a sharp pullback in Brent following signs of de-escalation in the US-Iran confrontation. They note that in the context of the US-Iran war, “Trump confirmed on Sunday that negotiations with Iran would resume on Monday after calling off what he described as the ‘biggest attack since World War II’ at the request of Gulf allies.” The US President “declined to set a deadline or disclose the location and participants,” but the prospect of renewed talks has eased immediate geopolitical risk.
According to Danske Bank, “oil prices fell sharply on signs of de-escalation, with Brent crude trading just below USD84/bbl this morning after closing around USD90/bbl on Friday.”
Meanwhile, recent comments from Federal Reserve (Fed) officials failed to support the USD.
Dallas Fed President Lorie Logan delivered a distinctly more hawkish message on Friday, with an FXS Speechtracker score of 8.7/10, notably above the 6.7/10 historical average and signaling a stronger tightening bias relative to the established baseline. The emphasis that “risks to inflation are to the upside,” that monetary policy is “not restraining” the economy, and that inflation is “not on course” to 2%—combined with a stated preference for a quarter-point rate increase—underscored concern that without additional policy restraint, inflation will remain above target and may ultimately require sharper action.
Following the previous week's sharp decline, USD/JPY came under heavy bearish pressure in the Asian session on Monday and touched its lowest level since early May below 155.50. The pair staged a rebound afterward and erased a large portion of its losses. At the time of press, USD/JPY was trading near 156.80, losing about 0.4% on the day.
Japan's Finance Minister Satsuki Katayama said on Monday that she has no comment on whether there was foreign exchange (FX) intervention today, Reuters reported.
Earlier in the day, Katayama stated that Japanese authorities conducted coordinated Yen-buying intervention with the US on Friday, adding that officials will not hesitate to carry out more FX intervention with Washington.
EUR/USD struggles to preserve its bullish momentum after rising in the Asian session and trades virtually unchanged at around 1.1520 in the European morning on Monday.
GBP/USD corrects lower following a three-day rally and trades slightly above 1.3450.
Gold finds it difficult to set a near-term direction and extends its sideways grind above $4,000 on Monday.
Risk sentiment FAQs
In the world of financial jargon the two widely used terms “risk-on” and “risk off'' refer to the level of risk that investors are willing to stomach during the period referenced. In a “risk-on” market, investors are optimistic about the future and more willing to buy risky assets. In a “risk-off” market investors start to ‘play it safe’ because they are worried about the future, and therefore buy less risky assets that are more certain of bringing a return, even if it is relatively modest.
Typically, during periods of “risk-on”, stock markets will rise, most commodities – except Gold – will also gain in value, since they benefit from a positive growth outlook. The currencies of nations that are heavy commodity exporters strengthen because of increased demand, and Cryptocurrencies rise. In a “risk-off” market, Bonds go up – especially major government Bonds – Gold shines, and safe-haven currencies such as the Japanese Yen, Swiss Franc and US Dollar all benefit.
The Australian Dollar (AUD), the Canadian Dollar (CAD), the New Zealand Dollar (NZD) and minor FX like the Ruble (RUB) and the South African Rand (ZAR), all tend to rise in markets that are “risk-on”. This is because the economies of these currencies are heavily reliant on commodity exports for growth, and commodities tend to rise in price during risk-on periods. This is because investors foresee greater demand for raw materials in the future due to heightened economic activity.
The major currencies that tend to rise during periods of “risk-off” are the US Dollar (USD), the Japanese Yen (JPY) and the Swiss Franc (CHF). The US Dollar, because it is the world’s reserve currency, and because in times of crisis investors buy US government debt, which is seen as safe because the largest economy in the world is unlikely to default. The Yen, from increased demand for Japanese government bonds, because a high proportion are held by domestic investors who are unlikely to dump them – even in a crisis. The Swiss Franc, because strict Swiss banking laws offer investors enhanced capital protection.

MUFG’s Michael Wan highlights that the Japanese Yen (JPY) has strengthened sharply, with USD/JPY dropping from around 164 after suspected intervention by Japan’s Ministry of Finance (MoF) and confirmed joint action with the US Treasury. He notes that past joint JPY interventions often coincide with turning points in USD/JPY, but stresses that fundamentals must shift for a durable move lower.
Historic joint action in Yen markets
"The Japanese Yen strengthened further below the 158 level heading into the weekend, with the media including the FT and Bloomberg reporting that the US Treasury intervened to strengthen the Japanese Yen on Friday by selling Euros to buy Yen."
"In Asia morning time, Japan’s Finance Minister Satsuki Katayama released a statement confirming that both Japan and the US Treasury intervened on Friday, and that they will not hesitate to conduct further joint intervention if necessary in close coordination with the US."
"Historical episodes of joint JPY intervention show that these events have typically taken place around key turning points in USD/JPY, but this is not always the case and tends to take some time before the broader trend changes."
"For instance, in June 1998, USD/JPY fell sharply from 146 to 136 within a few days, helped by joint FX intervention, but it took at least two more months after that and shifts in the underlying dynamics of the Asian Financial Crisis before USD/JPY’s longer-term trend broke."
"Overall, while we think that the joint intervention is certainly historic and significant, and could certainly play an important role in the short-term in clearing out Yen shorts, the fundamentals likely still need to change for a more durable move lower in USD/JPY."
(This article was created with the help of an Artificial Intelligence tool and reviewed by an editor. Know more.)

- USD/CAD edges higher to around 1.4030 in Monday’s early European session.
- Trump announced that fresh talks with Iran would begin on Monday.
- Traders will closely watch the US NFP report, which is due later on Friday.
The USD/CAD pair gathers strength to near 1.4030 during the early European session on Monday. A fall in crude oil prices weighs on the commodity-linked Canadian Dollar (CAD) against the US Dollar (USD). The US ISM Manufacturing Purchasing Managers Index (PMI) data will be released later on Monday.
Oil prices drop sharply on hopes of US-Iran talks. US President Donald Trump called off a planned military strike on Iran and said that fresh talks with Tehran would begin later in the day, easing concerns over potential supply disruptions. It is worth noting that Canada is a major oil-exporting country, and low crude oil prices generally have a negative impact on the Loonie.
The US employment data will take center stage on Friday. The US Nonfarm Payrolls (NFP) are expected to increase by 91,000 in July, versus 57,000 prior. The Unemployment Rate is projected to jump to 4.3% in July, up from 4.2% in June. If the reports show stronger-than-expected outcomes, this would reinforce bets on a US September rate hike and support the Greenback.
The US Federal Reserve (Fed) decided to leave interest rates unchanged at its July policy meeting last week. Markets have priced in nearly a 64.7% probability of a rate hike in September, down from about 77% before the July Fed meeting, according to the CME FedWatch tool.
Canadian Dollar gains capped as USD/CAD stalls near 1.40
Analysts at Scotiabank note that the Canadian Dollar has drawn support from “the generally softer USD undertone that has developing the past couple of days,” but they add that the currency “is having some trouble progressing through the 1.40 area” in USD/CAD, highlighting lingering resistance despite the improved backdrop.
Canadian Dollar FAQs
The key factors driving the Canadian Dollar (CAD) are the level of interest rates set by the Bank of Canada (BoC), the price of Oil, Canada’s largest export, the health of its economy, inflation and the Trade Balance, which is the difference between the value of Canada’s exports versus its imports. Other factors include market sentiment – whether investors are taking on more risky assets (risk-on) or seeking safe-havens (risk-off) – with risk-on being CAD-positive. As its largest trading partner, the health of the US economy is also a key factor influencing the Canadian Dollar.
The Bank of Canada (BoC) has a significant influence on the Canadian Dollar by setting the level of interest rates that banks can lend to one another. This influences the level of interest rates for everyone. The main goal of the BoC is to maintain inflation at 1-3% by adjusting interest rates up or down. Relatively higher interest rates tend to be positive for the CAD. The Bank of Canada can also use quantitative easing and tightening to influence credit conditions, with the former CAD-negative and the latter CAD-positive.
The price of Oil is a key factor impacting the value of the Canadian Dollar. Petroleum is Canada’s biggest export, so Oil price tends to have an immediate impact on the CAD value. Generally, if Oil price rises CAD also goes up, as aggregate demand for the currency increases. The opposite is the case if the price of Oil falls. Higher Oil prices also tend to result in a greater likelihood of a positive Trade Balance, which is also supportive of the CAD.
While inflation had always traditionally been thought of as a negative factor for a currency since it lowers the value of money, the opposite has actually been the case in modern times with the relaxation of cross-border capital controls. Higher inflation tends to lead central banks to put up interest rates which attracts more capital inflows from global investors seeking a lucrative place to keep their money. This increases demand for the local currency, which in Canada’s case is the Canadian Dollar.
Macroeconomic data releases gauge the health of the economy and can have an impact on the Canadian Dollar. Indicators such as GDP, Manufacturing and Services PMIs, employment, and consumer sentiment surveys can all influence the direction of the CAD. A strong economy is good for the Canadian Dollar. Not only does it attract more foreign investment but it may encourage the Bank of Canada to put up interest rates, leading to a stronger currency. If economic data is weak, however, the CAD is likely to fall.

- Gold kicks off the new week on a positive note, though it lacks any follow-through buying.
- Falling oil prices ease inflation fears and temper Fed hike bets, supporting the commodity.
- A modest USD bounce from its lowest level since June 17 caps gains for the XAU/USD pair.
Gold (XAU/USD) struggles to capitalize on a modest weekly bullish gap opening and remains below the $4,100 mark heading into the European session. The US Dollar (USD) stages a modest recovery from its lowest level since June 17, which, in turn, is seen capping the upside for the commodity. The upside for the USD, however, seems limited amid renewed hopes for a US-Iran peace deal and receding US Federal Reserve (Fed) rate-hike expectations, which, in turn, helps the non-yielding bullion to preserve gains above the $4,050 level.
US President Donald Trump called off planned attacks on Iran over the weekend, claiming that Mideast allies have reached the parameters of a deal on Tehran's nuclear program and the full reopening of the Strait of Hormuz. Trump further told reporters that the US and Iran are set to resume negotiations Monday afternoon, fueling optimism over a diplomatic resolution to end the five-month-old war. Adding to this, the OPEC+ decision on Sunday to increase production in September triggered a steep decline in crude oil prices. This eases inflation fears and tempers bets for a more aggressive Fed policy tightening, which should keep a lid on any meaningful USD appreciation and support the Gold price.
Traders, however, seem hesitant to place fresh bearish bets around the USD and opt to wait for further developments around the Middle East crisis. Hence, the focus remains glued to incoming geopolitical headlines, which might continue to infuse volatility in financial markets and drive the USD demand. Apart from this, traders will take cues from important US macro data, scheduled at the start of a new month, for some meaningful impetus. A busy week kicks off with the release of the US ISM Manufacturing PMI later this Monday. The market attention, meanwhile, stays on the crucial US monthly employment details, popularly known as the Nonfarm Payrolls (NFP) report on Friday.
XAU/USD daily chart
Technical Analysis: Gold's technical setup warrants caution for bullish traders
From a technical perspective, nothing seems to have changed much as the XAU/USD pair remains confined in a familiar range below the 200-day Simple Moving Average (SMA). Against the backdrop of the recent downfall, this might still be categorized as a bearish consolidation phase and suggests that the path of least resistance for the Gold price remains to the downside.
Meanwhile, the Moving Average Convergence Divergence (MACD) indicator (12, 26, close, 9) stays in positive territory with a reading near 11.6, hinting at tentative upside momentum. However, the Relative Strength Index (14) at 47.1 remains neutral and suggests only limited directional conviction. Hence, any further move up might struggle to find acceptance above $4,100.
The said handle is followed by the top boundary of the trading range, just ahead of the $4,200 mark, which, if cleared decisively, could lift Gold to the 200-day SMA near $4,490.33. Bulls would need to reclaim a technically significant barrier to alleviate the prevailing bearish tone and reopen the path toward higher highs.
On the downside, immediate support is inferred from recent swing lows around the $3,976–$4,000 area, where buyers previously emerged. A convincing break below would be seen as a fresh trigger for bearish traders and turn the XAU/USD pair vulnerable to further declines.
(The technical analysis of this story was written with the help of an AI tool. Know more.)
US Dollar Price Today
The table below shows the percentage change of US Dollar (USD) against listed major currencies today. US Dollar was the strongest against the Swiss Franc.
| USD | EUR | GBP | JPY | CAD | AUD | NZD | CHF | |
|---|---|---|---|---|---|---|---|---|
| USD | -0.00% | 0.15% | -0.47% | 0.12% | -0.10% | -0.04% | 0.19% | |
| EUR | 0.00% | 0.15% | -0.49% | 0.11% | -0.12% | -0.00% | 0.15% | |
| GBP | -0.15% | -0.15% | -0.61% | -0.06% | -0.26% | -0.14% | 0.03% | |
| JPY | 0.47% | 0.49% | 0.61% | 0.51% | 0.27% | 0.40% | 0.53% | |
| CAD | -0.12% | -0.11% | 0.06% | -0.51% | -0.23% | -0.10% | 0.02% | |
| AUD | 0.10% | 0.12% | 0.26% | -0.27% | 0.23% | 0.11% | 0.30% | |
| NZD | 0.04% | 0.00% | 0.14% | -0.40% | 0.10% | -0.11% | 0.18% | |
| CHF | -0.19% | -0.15% | -0.03% | -0.53% | -0.02% | -0.30% | -0.18% |
The heat map shows percentage changes of major currencies against each other. The base currency is picked from the left column, while the quote currency is picked from the top row. For example, if you pick the US Dollar from the left column and move along the horizontal line to the Japanese Yen, the percentage change displayed in the box will represent USD (base)/JPY (quote).

Commerzbank’s FX Research team reports that Brent Oil opened over 7% lower under USD84 into the Asian session after President Trump said the US would hold off on new strikes against Iran. Despite OPEC+ approving a modest output increase for September, the Strait of Hormuz remains effectively closed, keeping Persian Gulf export disruptions and inflation concerns in focus.
Trump decision hits Brent sharply
"The dominant story heading into the Asian open is that Brent oil prices have opened lower by over 7% to under USD84. This followed reports over the weekend that President Donald Trump said the US would hold off on new strikes against Iran. Iran and other Gulf nations indicated they are working toward a deal."
"President Trump posted on social media that he had agreed to cancel the attack “subject to being able to rapidly make a DEAL”, adding “Get to work, everybody, and get it DONE”. Saudi Arabian Crown Prince Mohammed bin Salman had reportedly urged Trump to refrain from further military action."
"The Strait of Hormuz remains effectively closed, continuing to disrupt Persian Gulf oil exports and stoking inflation concerns across Asia and Africa."
"On the energy front, OPEC+ approved a further increase of 188k barrels a day to collective output targets for September on Sunday, completing the theoretical unwinding of the 1.65mn barrels a day in voluntary cuts made in April 2023."
(This article was created with the help of an Artificial Intelligence tool and reviewed by an editor. Know more.)

