


ING’s Chris Turner highlights rare joint US-Japan FX intervention, with Washington participating via the Fed and Japan using the FIMA repo facility to raise Dollars against Treasuries. He argues the action does not alter fundamentals of a near-hiking Fed versus loose Japanese policy, and doubts USD/JPY can be driven sustainably below 155, seeing intervention mainly as a cap on moves toward 160.
Joint action unlikely to break 155
"The big story here is participation from Washington in bilateral intervention with Tokyo. The Fed had checked rates – a precursor to intervention – back in January, but seems to have pulled the trigger on Friday. Why now?"
"Perhaps US Treasury Secretary Scott Bessent had felt that the weak yen was undermining JGBs, which, in turn, was weighing on Treasuries. Notably, Japan has intimated it will be using the Fed's new FIMA repo facility. This allows it to raise dollars against Treasury holdings rather than having to outright sell Treasuries to undertake intervention."
"But equally, it does serve as a containment exercise, limiting investors from chasing USD/JPY through 160 and buying time for Tokyo to introduce more yen-positive policies. These could include more incentives to invest in Japanese domestic assets."
"There is a lot to say on this subject, but what does it mean for USD/JPY prospects? This intervention does not change the fundamentals of a Fed close to hiking and Tokyo running a loose set of monetary and fiscal policies, which are weighing on the yen. We struggle to see this bilateral action driving USD/JPY sustainably below 155."
(This article was created with the help of an Artificial Intelligence tool and reviewed by an editor. Know more.)

Nordea economists Kjetil Olsen and Sara Midtgaard expect Norges Bank to leave the policy rate at 4.25% at next week’s meeting. They highlight that June core inflation was well below the Bank’s projection and see July data remaining subdued. With unemployment and the Norwegian krone broadly in line with forecasts, they anticipate no immediate move while awaiting more inflation evidence.
Rate decision preview and inflation
"We expect Norges Bank to leave the policy rate unchanged at 4.25% next week."
"With inflation clearly below Norges Bank’s forecast, and with both unemployment and the Norwegian krone broadly in line with the June projections, a revised rate path produced today would likely be lower than the one published in June."
"We therefore expect Norges Bank to keep the policy rate unchanged next week and wait for more evidence on underlying inflationary pressures."
"That said, we still expect Norges Bank to deliver one further rate hike this autumn."
"As a result, there is a good chance that the gap between actual inflation and Norges Bank’s projected inflation path will narrow significantly following the August inflation release."
(This article was created with the help of an Artificial Intelligence tool and reviewed by an editor. Know more.)

Rabobank's Senior Market Strategist Benjamin Picton discusses recurring Middle East tensions around the Strait of Hormuz and their impact on Oil and Brent. Picton notes that strikes on Iran have been halted again, pushing Brent lower and supporting risk assets, but warns that later in the week strikes typically resume, Oil prices rally, equities sell and bond yields rise.
Hormuz dynamics drive energy volatility
"It’s Monday morning again and it feels like Groundhog Day as I sit down to write that the US President has (again) halted strikes on Iran and teased that a diplomatic breakthrough is close. Brent crude prices have dutifully fallen in early trade, risk currencies are rallying and equity markets are poised to extend the gains posted late last week."
"Of course, the other aspect of the Hormuz Groundhog Day is that later in the week strikes typically resume, oil prices rally, equities sell, and bond yields rise. While there is every chance of that happening this week for now the impression seems to be of ‘strikes for strikes’."
"Markets have so far taken large draws in global inventories in their stride with price rises mostly insufficient to cause severe demand destruction. At the same time, higher prices have induced a supply response by lifting US oil rig counts by almost 11% since the war broke out, increasing refinery capacity utilization, and prompting OPEC+ to announce another 188,000 lift in production quota from September onwards."
"The physical realities of war in the Eastern Europe and the Middle East have rendered the latter a mostly theoretical increase for the time being, but could contribute to a structural reshuffling of the energy deck on the other side of the current crisis. Product markets continue to provide the clearest hints of the seriousness of the current supply squeeze, with Singapore gasoil spot prices still sitting more than two standard deviations above the long-run spread to Brent."
(This article was created with the help of an Artificial Intelligence tool and reviewed by an editor. Know more.)

- EUR/GBP bounces up from 0.8540 lows but remains capped below 0.8570 so far.
- Final Manufacturing PMI data from Europe and the UK have been revised down on Monday.
- The pair is still showing a bullish structure but is struggling to return to the ascending channel.
The Euro (EUR) ticks higher against the British Pound (GBP) on Monday but remains capped below the bottom of an ascending channel at the 0.8575 area following Thursday and Friday's declines.
July’s Manufacturing Purchasing Managers Index (PMI) figures have been revised lower in the UK and the Eurozone, although the latter shows an improvement from June, while in the UK the sector’s activity slowed down compared to the previous month.
Beyond that, the uncertainty about the BoE’s monetary policy remains a significant hurdle for GBP recovery. Analysts at TD Securities observe that last week’s decision suggests that the majority of the committee “is still very comfortable keeping rates on hold, given the lack of clear second-round effects observed in inflation data.” In this context, “we think the knee-jerk GBP rally should be faded vs the EUR and USD. Further paring back of September BoE rate hike pricing could weigh on GBP,” say the analysts.
Technical analysis: Bulls are attempting to break the reverse trendline
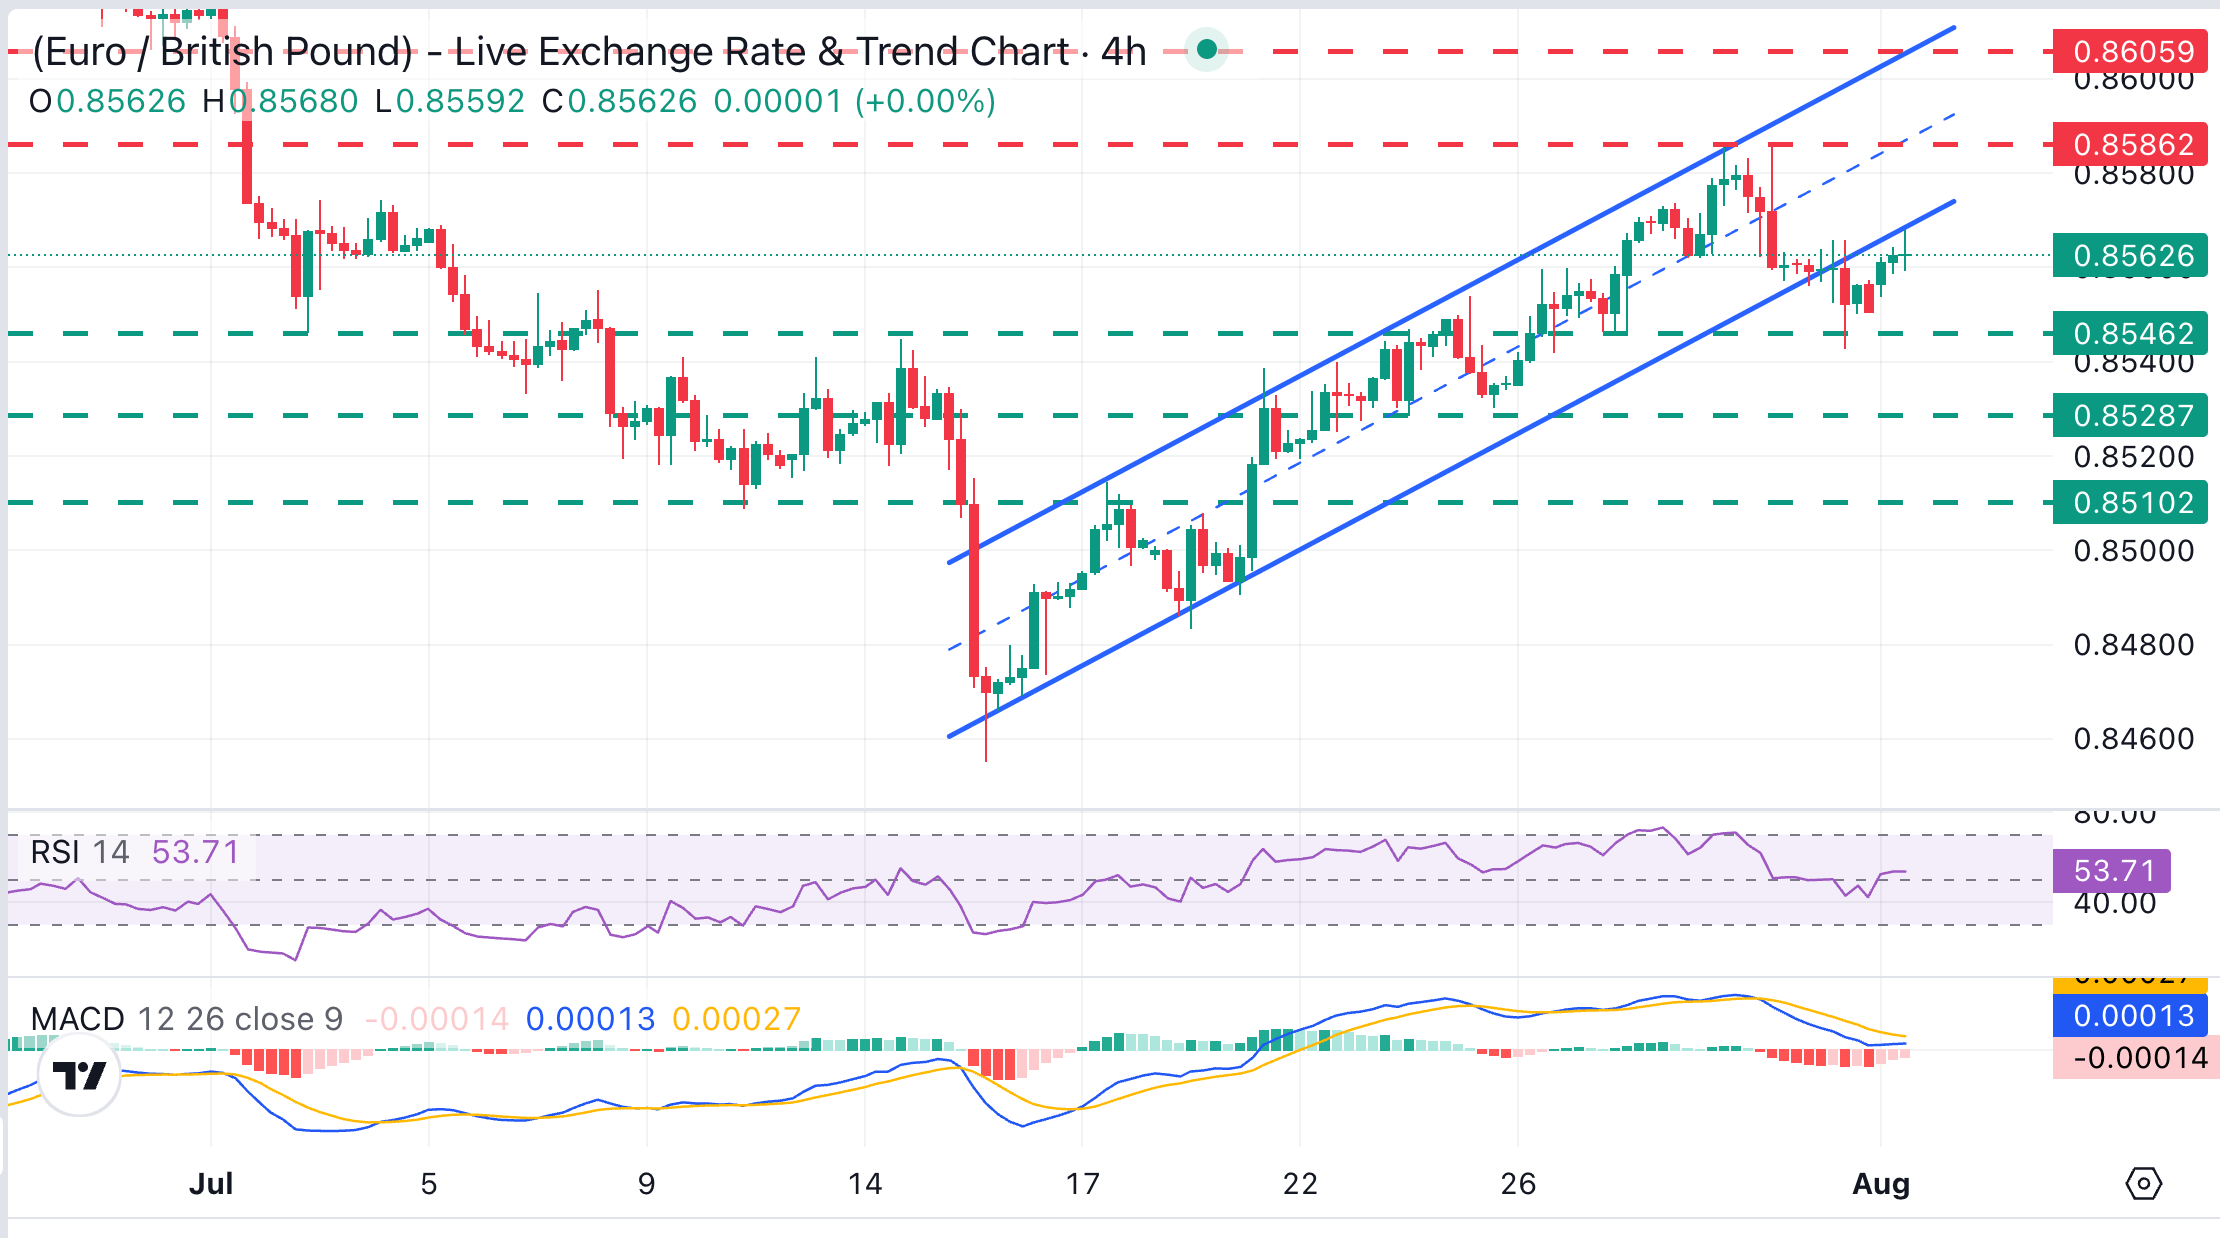
EUR/GBP trades at 0.8562, slipping just under the rising channel floor around 0.8570, which keeps the cross capped in the near term. Momentum indicators are mixed, with the 4-hour Relative Strength Index (RSI 14) around 53 and the Moving Average Convergence Divergence (MACD) fractionally negative, hinting at fading upside traction.
Failure to return above 0.8570 might encourage bears to retest the 0.8545 area, which capped bears on Friday and on July 28, as well as the July 23 low at 0.8530. On the topside, a confirmation above 0.8570 would expose the July 30 high at 0.8585. Further up, the late June lows just above 0.8600 emerge as the next resistance area.
(The technical analysis of this story was written with the help of an AI tool. Know more.)
Euro Price Today
The table below shows the percentage change of Euro (EUR) against listed major currencies today. Euro was the strongest against the Australian Dollar.
| USD | EUR | GBP | JPY | CAD | AUD | NZD | CHF | |
|---|---|---|---|---|---|---|---|---|
| USD | -0.08% | 0.07% | -0.50% | 0.05% | 0.20% | -0.00% | 0.05% | |
| EUR | 0.08% | 0.14% | -0.45% | 0.12% | 0.26% | 0.11% | 0.09% | |
| GBP | -0.07% | -0.14% | -0.57% | -0.05% | 0.12% | -0.02% | -0.03% | |
| JPY | 0.50% | 0.45% | 0.57% | 0.49% | 0.63% | 0.50% | 0.45% | |
| CAD | -0.05% | -0.12% | 0.05% | -0.49% | 0.14% | 0.01% | -0.04% | |
| AUD | -0.20% | -0.26% | -0.12% | -0.63% | -0.14% | -0.16% | -0.14% | |
| NZD | 0.00% | -0.11% | 0.02% | -0.50% | -0.01% | 0.16% | 0.00% | |
| CHF | -0.05% | -0.09% | 0.03% | -0.45% | 0.04% | 0.14% | -0.01% |
The heat map shows percentage changes of major currencies against each other. The base currency is picked from the left column, while the quote currency is picked from the top row. For example, if you pick the Euro from the left column and move along the horizontal line to the US Dollar, the percentage change displayed in the box will represent EUR (base)/USD (quote).
Deutsche Bank strategists outlines a United States (US) macro backdrop where the Federal Reserve (Fed) held rates but three officials dissented for a hike, keeping inflation concerns alive. They expect two further 25bp increases this year and closely watch upcoming labour and activity data. They note futures pricing of additional 2026 Fed moves and a steeper Treasury curve, underscoring ongoing policy‑driven Dollar dynamics.
Fed path tied to labour data
"The week ahead will be dominated by the US labour market, with the JOLTS report tomorrow, the ADP employment survey on Wednesday, and building up to Friday’s July employment report. "
"Looking at the US and then the rest of the world in more detail, attention will centre on whether incoming data reinforce the view that the US labour market remains resilient. Our economists expect Friday’s July payrolls report to show employment growth of +65k, modestly above June’s +57k reading, while private payrolls are also expected to rise by +65k after +49k previously."
"The unemployment rate is forecast to remain at 4.2%, although risks are skewed towards a rounding up to 4.3% if labour force participation rebounds after last month’s sharp decline. Average hourly earnings are expected to increase by +0.3% month-on-month, unchanged from June, while average hours worked are forecast to hold at 34.3 hours. If realised, those outcomes would leave our economists’ payroll proxy for nominal income growth unchanged at 4.4% year-on-year."
"Before Friday’s report, several labour market indicators will help shape expectations. The JOLTS report (tomorrow) and the ADP employment survey (Wednesday) will be closely watched, with our economists expecting ADP employment growth of +60k after +98k previously."
"Activity indicators will also feature prominently. The ISM manufacturing index (today) is expected to improve to 54.1 from 53.3, while the ISM services index (Wednesday) is forecast at 54.3, little changed from June’s 54.0. Productivity data (Thursday) should provide another read on underlying economic momentum, with our economists forecasting Q2 nonfarm productivity growth of +3.0% and unit labour costs rising by +0.5%."
(This article was created with the help of an Artificial Intelligence tool and reviewed by an editor. Know more.)

MUFG’s Lee Hardman notes that the Japanese Yen has strengthened as Japan and the US conducted joint intervention to counter recent volatility. He highlights planned use of the Federal Reserve’s FIMA Repo Facility, US euro-to-yen reallocations, and Japan’s sizeable FX reserves. Hardman also stresses more hawkish Bank of Japan guidance and lower Oil prices as reinforcing support for the Yen.
Yen aided by policy and energy moves
"The yen has continued to strengthen at the start of this week after Japanese Finance Minister Katayama confirmed overnight the Japan intervened alongside the US to support the yen on Friday. The statement justified the joint action to counter excessive volatility and disorderly movement in the yen in recent months, and emphasized that “we will not hesitate to conduct further joint intervention”. It was the first joint intervention involving Japan and the US since 18th March 2011 when joint intervention was undertaken after the 11th March Tohoku earthquake and tsunami to weaken the yen."
"At the same time, the statement from Finance Minister Katayama revealed that Japan also plans to utilize the Federal Reserve’s Foreign and International Monetary Authorities (FIMA) Repo Facility in the future. The facility enables Japan to access up to USD60 billion per day without selling Treasuries for up to seven days. The facility allows Japan to borrow US dollar temporarily by pledging Treasuries as collateral."
"With support from the US, intervention to support the yen will be viewed as more credible and if it proves more effective it could then mean that less intervention is ultimately required requiring less Treasury sales."
"Overall, the latest development give us more confidence in our forecasts that the yen is in the process of bottoming out. The threat of further joint intervention and a faster pace of BoJ hikes should provide more support for the yen, and discourage speculators from running elevated short yen positions."
"The comments signal that the BoJ may hike rates as soon as the next policy meeting in line with our forecasts rather than wait until the end of this year."
(This article was created with the help of an Artificial Intelligence tool and reviewed by an editor. Know more.)

- The Australian Dollar weakens after China's Manufacturing PMI misses expectations.
- The US Dollar rebounds after its recent pullback, weighing on AUD/USD.
- Markets remain cautious over conflicting US-Iran statements as investors await the ISM Manufacturing PMI.
AUD/USD falls to around 0.7000 on Monday at the time of writing, down 0.30% on the day, as a rebound in the US Dollar (USD) outweighs the support provided by Chinese economic data for the Australian Dollar (AUD).
China's RatingDog Manufacturing Purchasing Managers Index (PMI) slowed to 50.9 in July from 51.7 in June, missing the market consensus of 51.5. Despite the slowdown, the index remains above the 50 threshold, signaling continued expansion in manufacturing activity in Australia's largest trading partner, helping to limit losses in the Australian Dollar.
Comments from the Reserve Bank of Australia (RBA) also continue to support expectations of a restrictive monetary policy stance. RBA Assistant Governor Sarah Hunter said the recent moderation in inflation was mainly driven by lower fuel prices, while underlying inflationary pressures remain above the central bank's 2%-3% target range. Markets therefore continue to price in the possibility of another rate hike this year.
Meanwhile, the US Dollar (USD) is finding renewed support after its recent decline. Investors remain focused on geopolitical developments after US President Donald Trump said he had suspended planned military strikes against Iran to allow negotiations over Iran's nuclear program and the full reopening of the Strait of Hormuz to resume.
However, Iranian officials rejected Trump's claims, describing them as "another lie" and insisting that the country's armed forces remain on high alert. These conflicting statements continue to keep market sentiment cautious, limiting investors' appetite for risk.
Markets are also assessing the impact of the Organization of the Petroleum Exporting Countries and its allies (OPEC+) decision to increase production in September, a move that has contributed to lower Oil prices and reduced expectations of additional monetary tightening by the Federal Reserve (Fed).
Investors now turn their attention to the release of the Institute for Supply Management (ISM) Manufacturing PMI later on Monday, ahead of Friday's US Nonfarm Payrolls (NFP) report, which could provide fresh clues about the Fed's next monetary policy decisions.
Australian Dollar Price Today
The table below shows the percentage change of Australian Dollar (AUD) against listed major currencies today. Australian Dollar was the strongest against the Swiss Franc.
| USD | EUR | GBP | JPY | CAD | AUD | NZD | CHF | |
|---|---|---|---|---|---|---|---|---|
| USD | 0.02% | 0.15% | -0.36% | 0.15% | 0.31% | 0.17% | 0.22% | |
| EUR | -0.02% | 0.12% | -0.40% | 0.13% | 0.27% | 0.19% | 0.16% | |
| GBP | -0.15% | -0.12% | -0.49% | -0.03% | 0.15% | 0.07% | 0.06% | |
| JPY | 0.36% | 0.40% | 0.49% | 0.43% | 0.57% | 0.50% | 0.45% | |
| CAD | -0.15% | -0.13% | 0.03% | -0.43% | 0.16% | 0.08% | 0.03% | |
| AUD | -0.31% | -0.27% | -0.15% | -0.57% | -0.16% | -0.09% | -0.08% | |
| NZD | -0.17% | -0.19% | -0.07% | -0.50% | -0.08% | 0.09% | 0.00% | |
| CHF | -0.22% | -0.16% | -0.06% | -0.45% | -0.03% | 0.08% | -0.00% |
The heat map shows percentage changes of major currencies against each other. The base currency is picked from the left column, while the quote currency is picked from the top row. For example, if you pick the Australian Dollar from the left column and move along the horizontal line to the US Dollar, the percentage change displayed in the box will represent AUD (base)/USD (quote).

HSBC strategists note that the Federal Reserve (Fed) left policy rates unchanged in July, with markets now assigning a two-thirds probability to a September hike. They stress that Chair Warsh’s data-dependent stance puts upcoming United States (US) macro releases and inflation prints in focus, as labour market cooling and subdued core Consumer Price Index (CPI) could prompt investors to reassess the timing of any further rate increase.
Fed pause keeps September hike in play
"The Federal Reserve kept interest rates unchanged at its July meeting, as widely expected. Attention now shifts to September, with markets pricing in a two-thirds chance of a hike. With Chair Warsh unwilling to manage policy expectations and reiterating that the Fed is data dependent, upcoming macro releases take on added importance and could increase market volatility."
"Following a strong spring, payroll growth has moderated, while household sentiment suggests a softer labour market than the headline 4.2% unemployment rate implies. Any further cooling over the summer could prompt investors to reassess whether a September hike should be pushed back."
"The decision could go to the wire, with further CPI and payrolls releases landing shortly before the meeting. Unpredictable developments in the Middle East may also influence the outlook. Even if the Chair favoured using it, forward guidance could be a hostage to fortune at this point."
"Inflation data will be equally pivotal: a second consecutive subdued core CPI reading would cast doubt on whether broad-based price pressures are taking hold, particularly as labour cost growth appears contained and the housing market remains subdued."
(This article was created with the help of an Artificial Intelligence tool and reviewed by an editor. Know more.)
- The Indian Rupee starts the week on a positive note against the US Dollar due to multiple tailwinds.
- US President Trump halts attacks on Iran as it agrees to the nuclear deal and the Hormuz reopening.
- Investors await the RBI’s policy, which will be announced on Wednesday.
The Indian Rupee (INR) surrenders a majority of its early gains against the US Dollar (USD) near the closing session on Monday. The USD/INR is slightly lower at near 95.35, having recovered from its over three-week low of 95.15.
The Indian currency strengthened as the announcement of a ceasefire between the United States (US) and Iran after renewed hostilities in the Middle East in July has pushed oil prices sharply lower.
In the opening trade, the MCX Crude Oil contract expiring on August 19 trades over 6% lower to near Rs. 7,600.
Currencies from economies, such as India, which rely heavily on oil imports to meet their energy needs, tend to underperform in a high oil price environment.
US pauses Iran attacks
Over the weekend, US President Donald Trump announced that planned attacks on Iran have been suspended as the nation has agreed to the nuclear deal and the reopening of the Strait of Hormuz, a vital passage for almost 20% of the global energy supply.
“We have just been asked by Iran, and other Middle Eastern Countries, to hold off any attack in that the perimeters of a deal has been agreed to. This would include the Immediate, Complete, and Total OPENING OF THE HORMUZ STRAIT, and an end to Iran’s nuclear threat,” Trump wrote on Truth Social.
The renewed US-Iran peace hopes appear to have given a lifeline to Indian stock markets. At press time, the Nifty50 Index is up 0.7% at around 24,555.
RBI policy in focus
On the domestic front, the major event for the Indian currency this week will be the Reserve Bank of India’s (RBI) monetary policy announcement on Wednesday.
Economists at ING expect the Reserve Bank of India to leave the policy stance unchanged at its upcoming meeting, stating that “we expect the Reserve Bank of India to keep the repo rate unchanged at 5.25% on Wednesday.” They acknowledge that “headline inflation surprised to the upside in June, largely due to higher fuel prices,” but stress that “underlying price pressures remain contained.” In their view, “core inflation continues to run below the RBI's target, providing policymakers with sufficient room to keep policy rates unchanged while monitoring evolving risks to the inflation outlook.”
US Dollar recovers gains ahead of ISM Manufacturing PMI
The US Dollar Index (DXY) turns positive after a weak opening in the European session, trading marginally higher at around 99.82. The Greenback rebounds as traders are confident that the Federal Reserve (Fed) will deliver an interest rate hike at the September policy meeting. The USD Index opened lower as a significant plunge in oil prices diminished the appeal of safe-haven assets.
According to the CME FedWatch tool, the odds of the Fed hiking interest rates next month are 67.7%.
This week, investors will focus on a slew of US economic data, especially the US Nonfarm Payrolls (NFP) data for July, which will be released on Friday. Later in the day, investors will focus on the US ISM Manufacturing PMI data for July. The Manufacturing PMI is expected to arrive at 54.0, up from 53.3 in June.
Technical Analysis: USD/INR stays below 20-day EMA
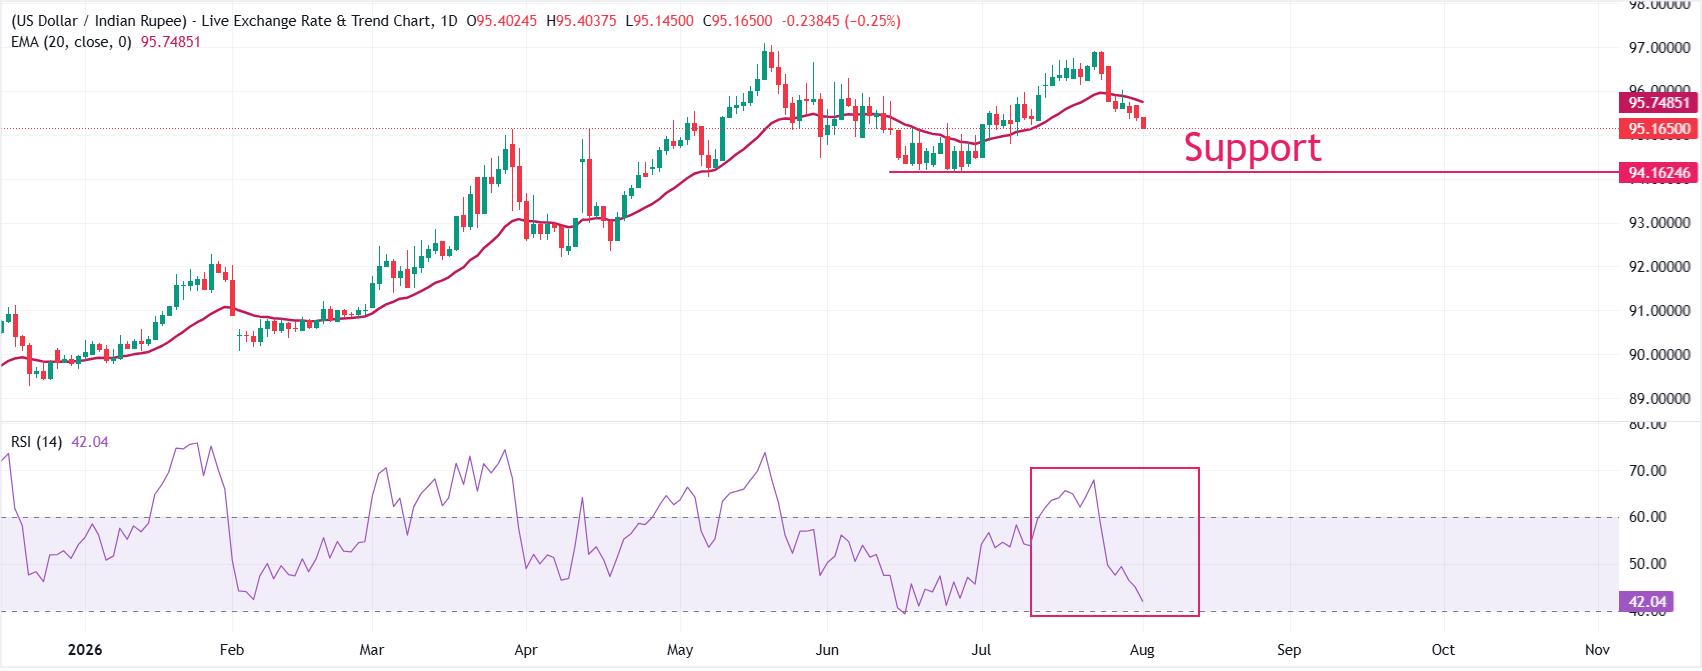
USD/INR trades lower at 95.35, keeping a bearish near-term tone as it holds below the 20-day exponential moving average (EMA) at 95.75. The EMA overhead suggests rallies remain capped for now, while the Relative Strength Index (RSI) at 42 stays below the neutral 50 line, hinting at lingering downside pressure rather than a decisive oversold condition.
On the topside, initial resistance is defined by the 20-day EMA clustered near 95.75, and a daily close above this barrier would be needed to ease the current bearish bias and open the way for a stronger recovery. On the downside, the July 7 low at 94.78 is the key support level, followed by the June 26 low at 94.15.
(The technical analysis of this story was written with the help of an AI tool. Know more.)
Economic Indicator
ISM Manufacturing PMI
The Institute for Supply Management (ISM) Manufacturing Purchasing Managers Index (PMI), released on a monthly basis, is a leading indicator gauging business activity in the US manufacturing sector. The indicator is obtained from a survey of manufacturing supply executives based on information they have collected within their respective organizations. Survey responses reflect the change, if any, in the current month compared to the previous month. A reading above 50 indicates that the manufacturing economy is generally expanding, a bullish sign for the US Dollar (USD). A reading below 50 signals that factory activity is generally declining, which is seen as bearish for USD.
Read more.Next release: Mon Aug 03, 2026 14:00
Frequency: Monthly
Consensus: 54
Previous: 53.3
Source: Institute for Supply Management
The Institute for Supply Management’s (ISM) Manufacturing Purchasing Managers Index (PMI) provides a reliable outlook on the state of the US manufacturing sector. A reading above 50 suggests that the business activity expanded during the survey period and vice versa. PMIs are considered to be leading indicators and could signal a shift in the economic cycle. Stronger-than-expected prints usually have a positive impact on the USD. In addition to the headline PMI, the Employment Index and the Prices Paid Index numbers are watched closely as they shine a light on the labour market and inflation.

