


- The US Dollar Index recovers toward 100 as strong US manufacturing data supports the Greenback.
- Markets weigh mixed US-Iran headlines alongside the Fed monetary policy outlook.
- Upcoming US labour data could shape expectations for the Fed’s September decision.
The US Dollar Index (DXY) stages a modest comeback on Monday as stronger-than-expected US manufacturing Purchasing Managers Index (PMI) data and uncertainty over US-Iran talks help the Greenback stabilize following last week’s sell-off, triggered by joint intervention from Washington and Tokyo to support the Japanese Yen (JPY).
At the time of writing, DXY trades around 100, recovering from an intraday low of 99.42, its weakest level since June 15.
The Greenback opened the week on the back foot after US President Donald Trump said over the weekend that he had called off a planned strike on Iran, with negotiations expected to begin on Monday. Sentiment quickly shifted after Iran denied holding talks with Washington.
Later in a post on Truth Social, Trump accused Iran’s leadership of being “duplicitous.” He also claimed that the US Navy controls the Strait of Hormuz and warned that the blockade would stay in place until Iran agrees to a deal or surrenders.
The hardline rhetoric from both sides casts doubt on the prospect of direct talks in the near term, keeping defensive demand for the US Dollar alive. However, uncertainty over the Federal Reserve’s (Fed) monetary policy path could limit the Greenback’s recovery.
Strategists at Brown Brothers Harriman argue that “the USD rally from May has run its course,” with the DXY “poised to retreat back into a 96.00-100.00 range.” While the bank acknowledges that “the tailwind to USD from resilient US economic activity” remains in place, they contend it is being increasingly offset by “Fed Chair Kevin Warsh's failure to turn tough inflation rhetoric into a credible policy,” undermining the policy backdrop that had previously supported the Dollar.
On the data front, the US ISM Manufacturing PMI rose to 55.6 in July from 53.3 in June, beating the market forecast of 54 and reaching its highest level since May 2022.
Attention now turns to this week's US labor market data for fresh clues on whether the Fed will raise interest rates in September. The CME FedWatch Tool shows markets pricing in around a 60% chance of a hike.
Economic Indicator
Nonfarm Payrolls
The Nonfarm Payrolls release presents the number of new jobs created in the US during the previous month in all non-agricultural businesses; it is released by the US Bureau of Labor Statistics (BLS). The monthly changes in payrolls can be extremely volatile. The number is also subject to strong reviews, which can also trigger volatility in the Forex board. Generally speaking, a high reading is seen as bullish for the US Dollar (USD), while a low reading is seen as bearish, although previous months' reviews and the Unemployment Rate are as relevant as the headline figure. The market's reaction, therefore, depends on how the market assesses all the data contained in the BLS report as a whole.
Read more.Next release: Fri Aug 07, 2026 12:30
Frequency: Monthly
Consensus: 83K
Previous: 57K
Source: US Bureau of Labor Statistics
America’s monthly jobs report is considered the most important economic indicator for forex traders. Released on the first Friday following the reported month, the change in the number of positions is closely correlated with the overall performance of the economy and is monitored by policymakers. Full employment is one of the Federal Reserve’s mandates and it considers developments in the labor market when setting its policies, thus impacting currencies. Despite several leading indicators shaping estimates, Nonfarm Payrolls tend to surprise markets and trigger substantial volatility. Actual figures beating the consensus tend to be USD bullish.
- US ISM Manufacturing PMI beat forecasts, supporting renewed US Dollar demand.
- UK fiscal concerns weigh as Burnham government seeks budget cuts.
- Iran talks ease Oil prices, tempering central-bank tightening expectations.
The Pound Sterling (GBP) retreats some 0.27% on Monday as the Greenback recovers some ground amid a pause in US strikes on Iran, while both parties are expected to resume negotiations aimed at securing a rapid deal. The GBP/USD pair trades at 1.3439, after reaching a daily high of 1.3506.
GBP/USD retreats as stronger US ISM Manufacturing PMI, UK fiscal concerns and easing Oil prices shape sentiment
The US Dollar (USD) remains stable as business activity in the manufacturing sector improved at its fastest pace since 2022. The ISM Manufacturing PMI for July improved from 53.3 to 55.6, exceeding estimates of 54. The employment sub-component in companies increased for the first time since 2023, while prices paid indicated that input costs remain elevated.
The US Dollar Index (DXY), which tracks the performance of the buck’s value against a basket of six currencies, is up 0.14% to 99.94. The Greenback leaked its wounds after two days of intervention in the FX markets to propel the Japanese Yen (JPY), according to Japanese and US authorities.
In the UK, investors are keenly digesting the fiscal policy of the new Prime Minister Andy Burnham. The Chancellor, John Healey, told cabinet ministers to make cuts to their budgets, as the new government scrambled to fulfill spending commitments made ahead of taking office.
Aside from this, geopolitics continues to make its rounds after US President Donald Trump halted attacks on Iran, at the request of Tehran and other Middle East countries. Recently, CBS News reported that no “new” negotiations are planned; it's the usual talks between Washington and Tehran, conducted through mediators, according to sources.
This eased Oil prices, with West Texas Intermediate (WTI), the US crude benchmark, down over 8.40%, below $80 a barrel.
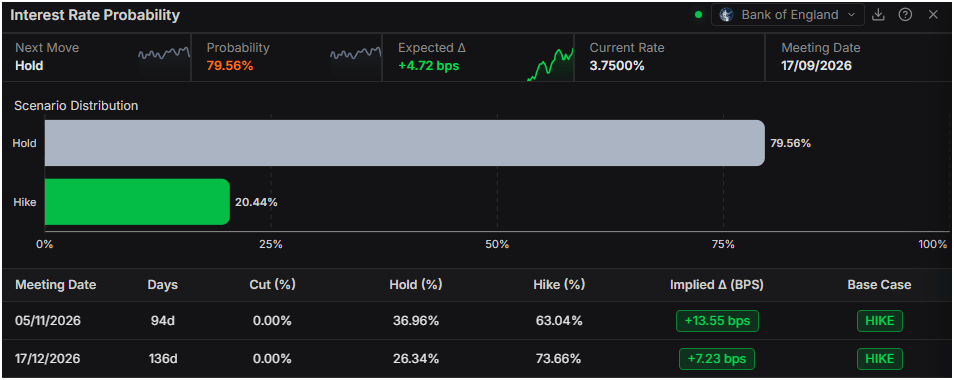
Meanwhile, expectations that major central banks – particularly the Fed and the Bank of England (BoE) – will increase rates eased. The US central bank is projected to tighten policy by 22 basis points, while the BoE is foreseen to raise rates once by the end of the year, according to Prime Terminal data.
GBP/USD Price Forecast: Technical outlook
In the daily chart, GBP/USD trades at 1.3428, holding a mildly bullish near-term bias as it stays above the cluster of simple moving averages (SMA) around 1.3363. Price is now testing the area just beneath the downward resistance trend line, which breaks at 1.3449, while the Relative Strength Index (RSI) at 54.5 suggests steady, non-overbought momentum that could allow for further upside as long as the pair defends its SMA support.
On the topside, immediate resistance is located at the descending trend-line break level of 1.3449, with a subsequent barrier emerging at the prior upward support trend-line break around 1.3551. On the downside, the key technical floor is provided by the grouped 50-, 100- and 200-period SMAs near 1.3363, where a daily close below would weaken the current constructive tone and expose a deeper corrective phase.
(The technical analysis of this story was written with the help of an AI tool. Know more.)
Pound Sterling Price Today
The table below shows the percentage change of British Pound (GBP) against listed major currencies today. British Pound was the strongest against the Swiss Franc.
| USD | EUR | GBP | JPY | CAD | AUD | NZD | CHF | |
|---|---|---|---|---|---|---|---|---|
| USD | 0.16% | 0.38% | -0.36% | 0.15% | 0.34% | 0.14% | 0.39% | |
| EUR | -0.16% | 0.21% | -0.54% | 0.00% | 0.16% | 0.02% | 0.19% | |
| GBP | -0.38% | -0.21% | -0.72% | -0.25% | -0.04% | -0.19% | 0.00% | |
| JPY | 0.36% | 0.54% | 0.72% | 0.43% | 0.59% | 0.47% | 0.62% | |
| CAD | -0.15% | 0.00% | 0.25% | -0.43% | 0.18% | 0.05% | 0.19% | |
| AUD | -0.34% | -0.16% | 0.04% | -0.59% | -0.18% | -0.15% | 0.05% | |
| NZD | -0.14% | -0.02% | 0.19% | -0.47% | -0.05% | 0.15% | 0.20% | |
| CHF | -0.39% | -0.19% | -0.00% | -0.62% | -0.19% | -0.05% | -0.20% |
The heat map shows percentage changes of major currencies against each other. The base currency is picked from the left column, while the quote currency is picked from the top row. For example, if you pick the British Pound from the left column and move along the horizontal line to the US Dollar, the percentage change displayed in the box will represent GBP (base)/USD (quote).
(This story was corrected on July 3 at 17:11 GMT to say that June's ISM Manufacturing PMI print was 53.3, not 53.5.)

- USD/JPY consolidates near the 156.90 zone on Monday as intervention keeps the Japanese Yen underpinned.
- Investors await the Bank of Japan Minutes for clues on how widely the hawkish shift has spread across the board.
- The US ADP Employment Change is expected to slow to 70K in July from 98K previously, testing the resilience of the Greenback.
USD/JPY trades with a soft tone near the 156.90 area on Monday as the Japanese Yen (JPY) holds the bulk of the gains secured at the end of last week, when intervention by Japanese authorities and a relatively hawkish Bank of Japan (BoJ) policy announcement triggered a sharp unwind in the pair.
Speculation that officials remain active in the market continues to cap attempts at recovery. Japanese authorities have offered no confirmation of last week's operation, but several news outlets reported the invention last Friday based on interviews with sources close to the BoJ. Ministry of Finance officials have limited their commentary to warnings that excessive, one-sided moves are undesirable and that they stand ready to act against disorderly conditions. That deliberate ambiguity is keeping traders reluctant to rebuild large Yen-short positions, with liquidity thinning around the figure levels where intervention is suspected to have been executed.
Attention now turns to the release of the BoJ Monetary Policy Meeting Minutes during the Asian session on Wednesday, which covers the June gathering and precedes both the intervention episode and last week's rate decision. While the document is dated, investors will scrutinize it for evidence that the hawkish tilt seen in the latest vote split was already building within the board. Any indication that a wider group of members had begun flagging upside inflation risks would strengthen the case for a follow-up rate increase and provide the Yen with an additional pillar of support.
The BoJ left its short-term rate unchanged at 1.00% last week in an 8–1 vote, with Governor Kazuo Ueda signaling that the central bank could accelerate the pace of tightening and would avoid falling behind the inflation curve. Markets have since brought forward the expected timing of the next hike, narrowing the interest rate differential that has driven the pair to multi-decade highs this year.
On the other side of the equation, the United States (US) ADP Employment Change is due on Wednesday, with the private payrolls gauge seen easing to 70K in July from 98K in June. A print in line with or below that estimate would point to a cooling labor market and could undermine the recent rebound in Treasury yields, adding to the pressure on USD/JPY.
Short-term technical analysis:
On the 4-hour chart, USD/JPY trades at 157.02, maintaining a bearish near-term bias as it holds beneath both the 20-period Simple Moving Average (SMA) at 160.36 and the 100-period SMA at 162.32. The pair is attempting to stabilize after the recent slide, but downside pressure remains evident, with the Relative Strength Index (RSI) hovering near oversold territory around 23, hinting that selling momentum could be stretched yet not decisively reversed.
On the topside, immediate resistance emerges at 157.15, followed by the recent horizontal cap at 157.94; a recovery above these levels would be needed to alleviate the current bearish tone. On the downside, initial support is located at 156.30, ahead of a stronger floor at 155.24, and a sustained break beneath these levels would reinforce the broader corrective phase in the pair.
(The technical analysis of this story was written with the help of an AI tool. Know more.)

- Oil remains under heavy pressure amid hopes for a deal between the United States and Iran.
- Investors await talks between Washington and Tehran on the Strait of Hormuz and Iran's nuclear program.
- OPEC+ production increase reinforces a stronger global supply outlook.
West Texas Intermediate (WTI) US Oil trades around $78.45 at the time of writing on Monday, down 7.76% on the day, as investors unwind the geopolitical risk premium following announcements of a potential agreement between the United States (US) and Iran.
US President Donald Trump said that a large-scale military strike against Iran had been suspended after Tehran agreed to the framework of a deal covering its nuclear program and the reopening of the Strait of Hormuz. The US President also said that talks between the two countries are scheduled to begin on Monday afternoon, fueling expectations of a de-escalation that could reduce the risk of disruptions to global Oil supplies.
However, Iran's Foreign Ministry struck a more cautious tone. Spokesperson Esmail Baghaei said that Tehran is currently holding no discussions with the United States regarding the reopening of the Strait of Hormuz, while confirming that talks with Oman on the issue are ongoing.
Meanwhile, the Organization of the Petroleum Exporting Countries and its allies (OPEC+) agreed on Sunday to increase production quotas by around 188,000 barrels per day from September, completing the unwinding of the voluntary output cuts introduced in 2023. The prospect of a stronger supply is adding further downward pressure on Oil prices.
Oil retreats as US-Iran diplomacy tempers fears but supply constraints persist
According to TD Securities, “renewed deal hopes have seen CTAs turn modest sellers of crude oil,” but the bank argues that “the market read is overly bearish, with global flows remaining heavily constrained.” Strategists highlight that “the production recovery in the Middle East has faltered amid the latest escalations,” warning that “any potential agreement similar to those that have failed within weeks, likely won't be enough to generate sufficient and consistent incoming tanker traffic.” They note that “flows through Hormuz, including Gulf of Oman ship-to-ship transfers, have been at 3-4.5m b/d in the last two weeks, which is in line with what the current production profile would imply,” underscoring that physical supply remains tight despite the latest pullback in prices.
BNY observes that “diplomacy buys time,” with the US and Iran “also communicating again, likely through regional intermediaries.” The bank reports that President Donald Trump “canceled planned strikes after allies outlined a potential framework covering de-escalation, the Strait of Hormuz and Iran’s nuclear program,” and that “oil prices have fallen sharply in response.” BNY notes that Trump said “new Iran talks would begin on Monday afternoon after he scrapped a planned military strike,” presenting the move as a response to “allied appeals from the Middle East, including Saudi Arabia,” and “as part of efforts to reach a broader deal.” According to BNY, Trump indicated the talks “could help reopen the Strait of Hormuz and keep alive a path to curb Iran’s nuclear program.” The bank adds that “the remarks eased market stress, with Brent crude falling sharply in early Monday trading after recent gains,” even as Iran countered that it currently has “no negotiations with the U.S.” In price terms, BNY cites Brent “-4.652% to 83.84, WTI -5.799% to 79.76, Omani crude -3.525% to 79.93, Dubai crude +1.8% to 81.109,” illustrating the sharp but uneven reaction across key benchmarks.
(This story was corrected on July 3 at 16:45 GMT to fix a misspelling in Iran's Foreign Ministry spokesman Esmail Baghaei's name.)
WTI Oil FAQs
WTI Oil is a type of Crude Oil sold on international markets. The WTI stands for West Texas Intermediate, one of three major types including Brent and Dubai Crude. WTI is also referred to as “light” and “sweet” because of its relatively low gravity and sulfur content respectively. It is considered a high quality Oil that is easily refined. It is sourced in the United States and distributed via the Cushing hub, which is considered “The Pipeline Crossroads of the World”. It is a benchmark for the Oil market and WTI price is frequently quoted in the media.
Like all assets, supply and demand are the key drivers of WTI Oil price. As such, global growth can be a driver of increased demand and vice versa for weak global growth. Political instability, wars, and sanctions can disrupt supply and impact prices. The decisions of OPEC, a group of major Oil-producing countries, is another key driver of price. The value of the US Dollar influences the price of WTI Crude Oil, since Oil is predominantly traded in US Dollars, thus a weaker US Dollar can make Oil more affordable and vice versa.
The weekly Oil inventory reports published by the American Petroleum Institute (API) and the Energy Information Agency (EIA) impact the price of WTI Oil. Changes in inventories reflect fluctuating supply and demand. If the data shows a drop in inventories it can indicate increased demand, pushing up Oil price. Higher inventories can reflect increased supply, pushing down prices. API’s report is published every Tuesday and EIA’s the day after. Their results are usually similar, falling within 1% of each other 75% of the time. The EIA data is considered more reliable, since it is a government agency.
OPEC (Organization of the Petroleum Exporting Countries) is a group of 12 Oil-producing nations who collectively decide production quotas for member countries at twice-yearly meetings. Their decisions often impact WTI Oil prices. When OPEC decides to lower quotas, it can tighten supply, pushing up Oil prices. When OPEC increases production, it has the opposite effect. OPEC+ refers to an expanded group that includes ten extra non-OPEC members, the most notable of which is Russia.

- USD/CHF extends gains as softer Swiss inflation and a modest recovery in the Greenback support the pair.
- The pair retests the 21-day SMA, while holding above the 50-day and 100-day SMAs.
- Neutral RSI and a negative MACD point to steady, rather than strong, upside momentum.
USD/CHF edges higher on Monday as softer Swiss inflation data and a modest recovery in the US Dollar (USD) weigh on the Swiss Franc (CHF). At the time of writing, the pair trades around 0.8109, up 0.38% on the day.
Franc under pressure as muted Swiss inflation keeps SNB on hold
Strategists at Brown Brothers Harriman highlight that "Swiss July CPI stays muted," with inflation data underscoring the lack of price pressures in the economy. They note that, "in line with consensus, headline CPI printed at 0.4% y/y vs. 0.5% in June while core CPI remained at 0.3% y/y for a fourth straight month."
Against this backdrop, BBH concludes that the "bottom line: the SNB has plenty of room to keep rates at 0.00% for some time, which is an ongoing drag for CHF," adding that the Franc is currently "the worst performing G10 currency so far this quarter."
On the US side, the Greenback shows signs of stabilization following last week’s sell-off, triggered by coordinated intervention from Washington and Tokyo to counter excessive weakness in the Japanese Yen (JPY). Stronger-than-expected US ISM Manufacturing Purchasing Managers Index (PMI) data lends some support to the Greenback.
The US Dollar Index (DXY), which tracks the Greenback’s value against a basket of six major currencies, trades around 99.96, rebounding from an intraday low of 99.42, its weakest level since June 15.
Technical analysis
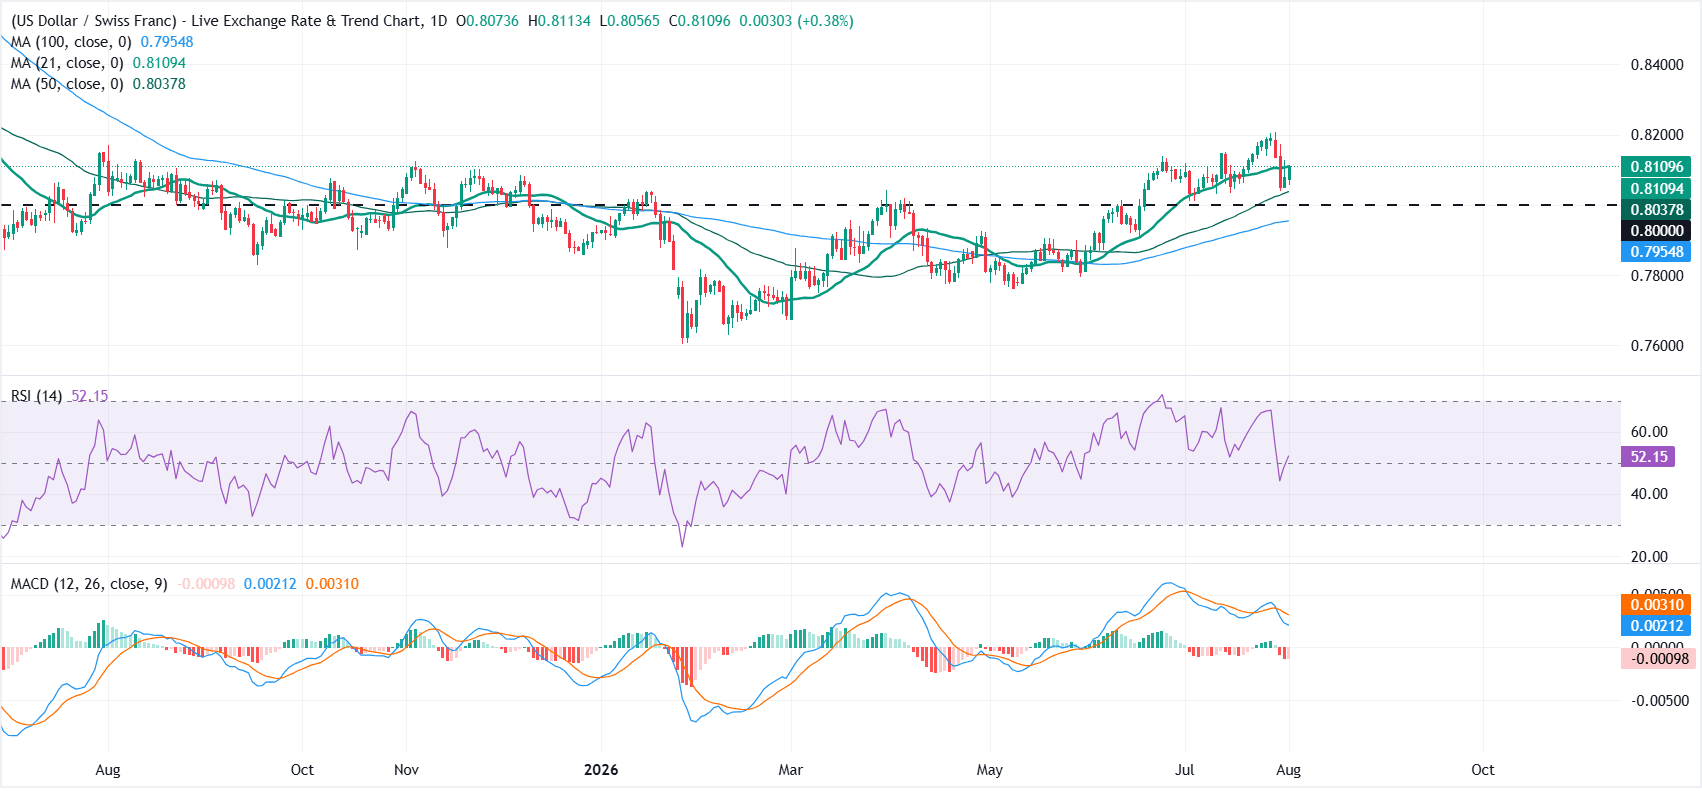
On the daily chart, USD/CHF retests the 21-day Simple Moving Average (SMA) near 0.8110 after slipping below it last week. The pair is above the 50-day and 100-day SMAs, keeping the broader outlook mildly constructive.
Momentum is mixed, with the Relative Strength Index (14) hovering near a neutral 52.5 and the Moving Average Convergence Divergence (MACD) still in negative territory, which suggests upside may be steady rather than explosive in the near term.
On the upside, a daily close above the 21-day SMA would bring the psychological 0.8200 level back into focus. A decisive break above this area could open the door to additional gains.
On the downside, immediate support is seen at the 21-day SMA around 0.8110, followed by the 50-day SMA at 0.8038, ahead of the horizontal support near 0.8000 and the 100-day SMA at 0.7955.
As long as USD/CHF holds above this layered demand zone, the pair would likely continue to trade with a mild bullish bias, with any decisive break below 0.8000 needed to weaken the broader constructive tone and expose deeper retracements.
(The technical analysis of this story was written with the help of an AI tool. Know more.)
SNB FAQs
The Swiss National Bank (SNB) is the country’s central bank. As an independent central bank, its mandate is to ensure price stability in the medium and long term. To ensure price stability, the SNB aims to maintain appropriate monetary conditions, which are determined by the interest rate level and exchange rates. For the SNB, price stability means a rise in the Swiss Consumer Price Index (CPI) of less than 2% per year.
The Swiss National Bank (SNB) Governing Board decides the appropriate level of its policy rate according to its price stability objective. When inflation is above target or forecasted to be above target in the foreseeable future, the bank will attempt to tame excessive price growth by raising its policy rate. Higher interest rates are generally positive for the Swiss Franc (CHF) as they lead to higher yields, making the country a more attractive place for investors. On the contrary, lower interest rates tend to weaken CHF.
Yes. The Swiss National Bank (SNB) has regularly intervened in the foreign exchange market in order to avoid the Swiss Franc (CHF) appreciating too much against other currencies. A strong CHF hurts the competitiveness of the country’s powerful export sector. Between 2011 and 2015, the SNB implemented a peg to the Euro to limit the CHF advance against it. The bank intervenes in the market using its hefty foreign exchange reserves, usually by buying foreign currencies such as the US Dollar or the Euro. During episodes of high inflation, particularly due to energy, the SNB refrains from intervening markets as a strong CHF makes energy imports cheaper, cushioning the price shock for Swiss households and businesses.
The SNB meets once a quarter – in March, June, September and December – to conduct its monetary policy assessment. Each of these assessments results in a monetary policy decision and the publication of a medium-term inflation forecast.

- AUD/USD falls toward 0.6990 as stronger-than-expected US ISM Manufacturing PMI data boosts the US Dollar.
- US manufacturing activity strengthens in July, with the ISM Manufacturing PMI rising to 55.6 and New Orders climbing to 56.7.
- Focus shifts to Australia's final S&P Global Services and Composite PMIs and China's RatingDog Services PMI, seen easing to 53.7.
AUD/USD extends its pullback toward the 0.6990 area during Monday's American session after stronger-than-expected United States (US) manufacturing data reinforced the US Dollar (USD). The pair had rallied above 0.7050 at the start of trading this week but failed to sustain gains as investors reassessed the Federal Reserve (Fed) outlook following resilient economic activity.
The ISM Manufacturing Purchasing Managers Index (PMI) rose to 55.6 in July, beating market expectations of 54.0 and improving from 53.3 in June. Meanwhile, the New Orders Index increased to 56.7 from 56.0, pointing to solid demand across the manufacturing sector. The Prices Paid Index eased to 71.1 from 73.0, although it remained well above the 50 threshold, suggesting inflationary pressure continues to persist despite some moderation.
The stronger ISM figures prompted a rebound in US Treasury yields and supported the Greenback, weighing on risk-sensitive currencies such as the Australian Dollar (AUD). However, the softer reading in the Prices Paid component could temper expectations of an even more aggressive Fed stance if inflation continues to cool gradually.
Attention now turns to the Asia-Pacific session, where Australia will release the final S&P Global Services and Composite PMIs for July. Markets expect the Services index to be confirmed at 53.0 and the Composite gauge at 52.6, both unchanged from their prior readings and consistent with a modest but steady expansion in private-sector activity. An upside surprise on either measure could hand the Aussie renewed support by reinforcing confidence in domestic business conditions, while a downward revision would suggest momentum in the services sector is fading.
Traders will also keep a close eye on China's RatingDog Services PMI, the privately compiled survey covering Australia's largest trading partner. The index is forecast at 53.7 in July, easing from 54.1 in June but still holding comfortably above the 50 mark that separates expansion from contraction.
Short-term technical analysis:
On the 4-hour chart, AUD/USD trades at 0.6993, hovering just under the 20-period Simple Moving Average (SMA) at 0.6997 while holding above the 100-period SMA at 0.6984, which suggests a broadly neutral near-term tone with a slight downside risk. The horizontal support at 0.6985 aligns with the longer-term SMA, forming a nearby demand area, while the Relative Strength Index (RSI) around 47 hints at consolidative momentum rather than a clear trending phase.
On the topside, initial resistance emerges at the 20-period SMA near 0.6997, followed by the horizontal barriers at 0.6999, 0.7009 and the former opening level at 0.7018, which together define a gradual supply zone overhead. On the downside, immediate support is seen at 0.6985, with the 100-period SMA at 0.6984 reinforcing this floor; a sustained break beneath this cluster would open the door to a deeper pullback within the current range.
(The technical analysis of this story was written with the help of an AI tool. Know more.)

United Overseas Bank’s (UOB) Quek Ser Leang notes USD/SGD slipped to 1.2809 but closed near 1.2821, with intraday bias still pointing lower. However, he highlights 1.2790 as significant support that may hold unless momentum improves, while 1.2845 marks the level that would negate the downside bias. Over the 1–3 week horizon, further losses require a clear break below 1.2790.
Downside risk constrained by support
"24-HOUR VIEW: USD fell to a low of 1.2809 last Friday before closing largely unchanged at 1.2821 (+0.06%). While the bias remains tilted to the downside today, given that there is no clear increase in downward momentum, any decline may not break the significant support at 1.2790. On the upside, a breach of 1.2845 would indicate that the downside bias has faded."
"1-3 WEEKS VIEW: USD fell sharply last week, closing down by 0.67% at 1.2821. Strong momentum suggests further downside risk, but USD must break and hold below the significant support at 1.2790 before further declines are likely. The risk of USD breaking clearly below 1.2790 will remain intact as long as USD holds below 1.2875 (‘strong resistance’ level). Looking ahead, the next level to watch below 1.2790 is 1.2765."
(This article was created with the help of an Artificial Intelligence tool and reviewed by an editor. Know more.)

- Silver falls toward $57.20 after stronger-than-expected US ISM Manufacturing PMI data.
- Robust US manufacturing activity reinforces expectations of a hawkish Federal Reserve.
- Investors scale back easing expectations, weighing on precious metals.
Silver (XAG/USD) trades around $57.20 at the time of writing on Monday, down 0.73% on the day, after a strong US manufacturing report reinforced expectations that the Federal Reserve (Fed) will maintain a restrictive monetary policy.
The Institute for Supply Management (ISM) reported that its Manufacturing Purchasing Managers Index (PMI) rose to 55.6 in July from 53.3 in June, beating market expectations of 54. The release showed that US manufacturing activity accelerated at its fastest pace in more than four years.
The report's underlying components also pointed to a resilient manufacturing sector. The Employment Index climbed to 52.8 from 49.7, signaling a return to payroll growth, while the Prices Paid Index eased slightly to 71.1 from 73 but remained above the market forecast of 70.3, indicating that inflationary pressures remain elevated.
According to Susan Spence, Chair of the ISM Manufacturing Business Survey Committee, four of the five PMI sub-indices accelerated compared with June, confirming the strengthening momentum in the manufacturing sector.
The stronger economic data provide the Federal Reserve (Fed) with greater flexibility to tighten monetary policy further in its fight against inflation. Higher-for-longer interest rate expectations increase the opportunity cost of holding non-yielding assets such as Silver, limiting the metal's upside despite the recent support provided by easing geopolitical tensions in the Middle East.
Silver FAQs
Silver is a precious metal highly traded among investors. It has been historically used as a store of value and a medium of exchange. Although less popular than Gold, traders may turn to Silver to diversify their investment portfolio, for its intrinsic value or as a potential hedge during high-inflation periods. Investors can buy physical Silver, in coins or in bars, or trade it through vehicles such as Exchange Traded Funds, which track its price on international markets.
Silver prices can move due to a wide range of factors. Geopolitical instability or fears of a deep recession can make Silver price escalate due to its safe-haven status, although to a lesser extent than Gold's. As a yieldless asset, Silver tends to rise with lower interest rates. Its moves also depend on how the US Dollar (USD) behaves as the asset is priced in dollars (XAG/USD). A strong Dollar tends to keep the price of Silver at bay, whereas a weaker Dollar is likely to propel prices up. Other factors such as investment demand, mining supply – Silver is much more abundant than Gold – and recycling rates can also affect prices.
Silver is widely used in industry, particularly in sectors such as electronics or solar energy, as it has one of the highest electric conductivity of all metals – more than Copper and Gold. A surge in demand can increase prices, while a decline tends to lower them. Dynamics in the US, Chinese and Indian economies can also contribute to price swings: for the US and particularly China, their big industrial sectors use Silver in various processes; in India, consumers’ demand for the precious metal for jewellery also plays a key role in setting prices.
Silver prices tend to follow Gold's moves. When Gold prices rise, Silver typically follows suit, as their status as safe-haven assets is similar. The Gold/Silver ratio, which shows the number of ounces of Silver needed to equal the value of one ounce of Gold, may help to determine the relative valuation between both metals. Some investors may consider a high ratio as an indicator that Silver is undervalued, or Gold is overvalued. On the contrary, a low ratio might suggest that Gold is undervalued relative to Silver.

- Gold struggles to hold its early advance on Monday as traders weigh conflicting US-Iran headlines.
- Hawkish Fed expectations continue to cap gains ahead of a packed US economic calendar.
- Momentum indicators suggest consolidation, with the RSI near neutral and the ADX pointing to weakening trend strength.
Gold (XAU/USD) trims gains after opening the week with a bullish gap as buyers lack conviction amid conflicting US-Iran headlines and caution ahead of key US employment data. At the time of writing, XAU/USD trades around $4,036, easing from an intraday high of $4,084.
US President Donald Trump said over the weekend that he had called off a planned strike on Iran, with negotiations expected to begin on Monday. The announcement lifted hopes of a peace deal and sent Oil prices sharply lower, with West Texas Intermediate (WTI) down more than 8% at the time of writing.
The pullback in Oil prices eases immediate inflation concerns and pulls US Treasury yields lower, offering support to Gold. However, supply disruptions through the Strait of Hormuz keep Oil prices above pre-war levels.
Iranian Foreign Ministry spokesperson Esmaeil Baghaei also said Tehran is not currently holding talks with Washington, keeping traders sceptical about the chances of a deal and the full reopening of the Strait.
As a result, broader inflation concerns remain alive, and traders still see a high likelihood of the Fed raising interest rates this year. New York Fed President John Williams said on Monday that “rate policy is still well positioned to reach 2% inflation,” adding that “if inflation is not on track to 2%, the Fed will intervene to restore price stability.”
The CME FedWatch Tool shows that traders see a 65% chance of a rate hike in September. These hawkish bets continue to cap Gold’s upside despite broad weakness in the US Dollar (USD), driven by intervention from Japanese authorities to support the Yen.
On the US economic calendar, the ISM Manufacturing Purchasing Managers’ Index (PMI) is due later on Monday, followed by the JOLTS Job Openings report on Tuesday, ADP Employment Change on Wednesday and Nonfarm Payrolls (NFP) on Friday. The figures could offer fresh clues on the Fed's monetary policy outlook.
Technical analysis: Neutral RSI points to consolidation above $4,000
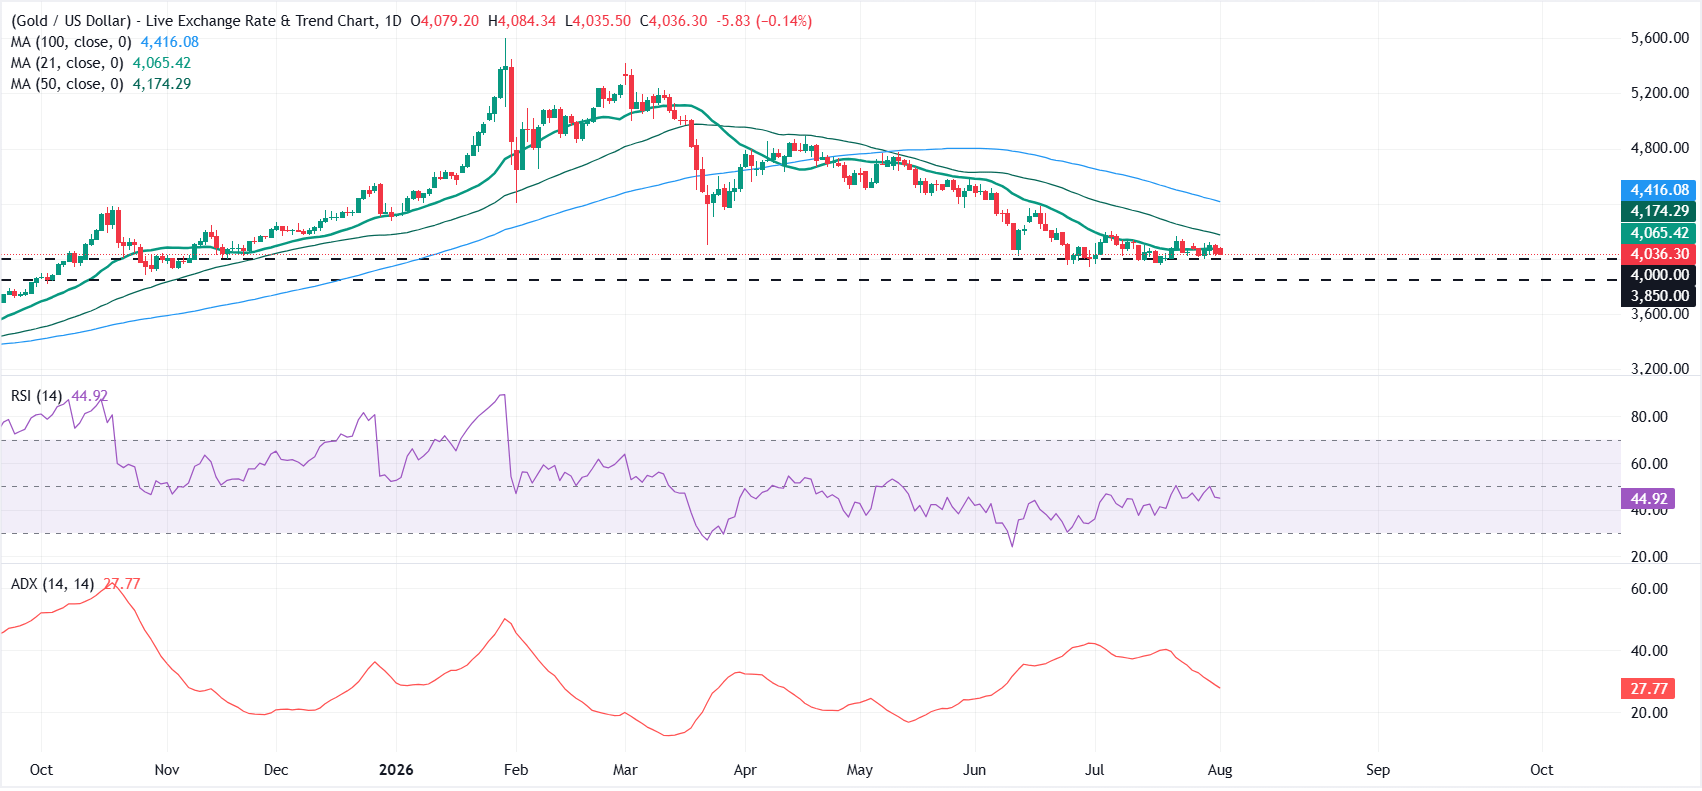
On the daily chart, XAU/USD maintains a capped tone as it trades below the 21-day Simple Moving Average (SMA) and well under the 50-day and 100-day SMAs.
This configuration suggests the broader trend is still under pressure, even as the Relative Strength Index (RSI) at 46 has recovered toward neutral and the Average Directional Index (ADX) at 27 hints at easing trend strength after the recent decline.
On the topside, immediate resistance is seen at the 21-day SMA near $4,065, followed by a more significant barrier at the 50-day SMA around $4,174, with the 100-day SMA at $4,416 reinforcing the broader bearish cap.
On the downside, initial support aligns with the horizontal level at $4,000, ahead of a deeper structural floor at $3,850, and a daily close below $4,000 would likely reopen the path toward the lower band of this support zone.
(The technical analysis of this story was written with the help of an AI tool. Know more.)
Gold FAQs
Gold has played a key role in human’s history as it has been widely used as a store of value and medium of exchange. Currently, apart from its shine and usage for jewelry, the precious metal is widely seen as a safe-haven asset, meaning that it is considered a good investment during turbulent times. Gold is also widely seen as a hedge against inflation and against depreciating currencies as it doesn’t rely on any specific issuer or government.
Central banks are the biggest Gold holders. In their aim to support their currencies in turbulent times, central banks tend to diversify their reserves and buy Gold to improve the perceived strength of the economy and the currency. High Gold reserves can be a source of trust for a country’s solvency. Central banks added 1,136 tonnes of Gold worth around $70 billion to their reserves in 2022, according to data from the World Gold Council. This is the highest yearly purchase since records began. Central banks from emerging economies such as China, India and Turkey are quickly increasing their Gold reserves.
Gold has an inverse correlation with the US Dollar and US Treasuries, which are both major reserve and safe-haven assets. When the Dollar depreciates, Gold tends to rise, enabling investors and central banks to diversify their assets in turbulent times. Gold is also inversely correlated with risk assets. A rally in the stock market tends to weaken Gold price, while sell-offs in riskier markets tend to favor the precious metal.
The price can move due to a wide range of factors. Geopolitical instability or fears of a deep recession can quickly make Gold price escalate due to its safe-haven status. As a yield-less asset, Gold tends to rise with lower interest rates, while higher cost of money usually weighs down on the yellow metal. Still, most moves depend on how the US Dollar (USD) behaves as the asset is priced in dollars (XAU/USD). A strong Dollar tends to keep the price of Gold controlled, whereas a weaker Dollar is likely to push Gold prices up.

- EUR/USD trades in a narrow range as traders await clarity on US-Iran negotiations.
- Strong US manufacturing data and a stabilizing US Dollar cap the Euro’s upside.
- Upcoming US employment data could shape expectations for the Fed’s next policy move.
EUR/USD trades in a narrow range on Monday as traders await clarity on US-Iran negotiations, while signs of stabilization in the US Dollar following the recent intervention-led weakness cap the Euro’s upside.
At the time of writing, the pair trades around 1.1515 after reaching an intraday high of 1.1558, its highest level since June 17.
US President Donald Trump said over the weekend that he had called off a planned strike on Iran, with negotiations expected to begin on Monday. However, Iranian Foreign Ministry spokesperson Esmaeil Baghaei said Tehran is not currently holding talks with Washington. The conflicting headlines keep geopolitical uncertainty alive and leave market sentiment cautious.
Traders also assess the latest business activity data from both sides of the Atlantic. The US ISM Manufacturing Purchasing Managers’ Index (PMI) rose to 55.6 in July from 53.3 in June, beating expectations of 54.0 and marking its highest reading since May 2022. The sector expanded for a seventh consecutive month following ten months of contraction.
Meanwhile, the Eurozone Manufacturing PMI improved to a three-month high of 51.9 from 51.4 in June, although it fell short of the market forecast of 52.0. The stronger-than-expected US reading offers some support to the US Dollar.
The US Dollar Index (DXY), which tracks the Greenback’s value against a basket of six major currencies, trades around 99.84 after rebounding from an intraday low of 99.42, its weakest level since June 15.
Dollar outlook darkens as Fed caution and US-Japan action sap confidence
Economists at DBS argue that “the greenback’s trajectory looks bleak in August after stumbling badly at the end of July,” with a combination of policy and geopolitical factors leaving the Dollar exposed. They highlight “the confluence of a Fed seemingly reluctant to hike, coordinated US-Japan currency interventions, and a cooling geopolitical landscape in the Middle East” as key forces that “keep the USD vulnerable.”
DBS notes that “Fed Chairman Kevin Warsh has unsettled investors who had amassed long USD positions betting on his hawkish credentials.” Instead of signalling that rates may rise, “Warsh used the July 28-29 FOMC meeting to focus on institutional reforms, especially scaling back forward guidance.”
Attention now turns to upcoming US employment data for fresh clues on the Fed’s policy path. The JOLTS Job Openings report is due on Tuesday, followed by ADP Employment Change on Wednesday and Nonfarm Payrolls (NFP) on Friday.
Nonfarm Payrolls FAQs
Nonfarm Payrolls (NFP) are part of the US Bureau of Labor Statistics monthly jobs report. The Nonfarm Payrolls component specifically measures the change in the number of people employed in the US during the previous month, excluding the farming industry.
The Nonfarm Payrolls figure can influence the decisions of the Federal Reserve by providing a measure of how successfully the Fed is meeting its mandate of fostering full employment and 2% inflation. A relatively high NFP figure means more people are in employment, earning more money and therefore probably spending more. A relatively low Nonfarm Payrolls’ result, on the either hand, could mean people are struggling to find work. The Fed will typically raise interest rates to combat high inflation triggered by low unemployment, and lower them to stimulate a stagnant labor market.
Nonfarm Payrolls generally have a positive correlation with the US Dollar. This means when payrolls’ figures come out higher-than-expected the USD tends to rally and vice versa when they are lower. NFPs influence the US Dollar by virtue of their impact on inflation, monetary policy expectations and interest rates. A higher NFP usually means the Federal Reserve will be more tight in its monetary policy, supporting the USD.
Nonfarm Payrolls are generally negatively-correlated with the price of Gold. This means a higher-than-expected payrolls’ figure will have a depressing effect on the Gold price and vice versa. Higher NFP generally has a positive effect on the value of the USD, and like most major commodities Gold is priced in US Dollars. If the USD gains in value, therefore, it requires less Dollars to buy an ounce of Gold. Also, higher interest rates (typically helped higher NFPs) also lessen the attractiveness of Gold as an investment compared to staying in cash, where the money will at least earn interest.
Nonfarm Payrolls is only one component within a bigger jobs report and it can be overshadowed by the other components. At times, when NFP come out higher-than-forecast, but the Average Weekly Earnings is lower than expected, the market has ignored the potentially inflationary effect of the headline result and interpreted the fall in earnings as deflationary. The Participation Rate and the Average Weekly Hours components can also influence the market reaction, but only in seldom events like the “Great Resignation” or the Global Financial Crisis.

