


The upcoming week will bring a fresh test for major currency pairs as investors return from the US Independence Day holiday and continue to digest weaker US labor market data. The release of the last Federal Open Market Committee (FOMC) minutes and Initial Jobless Claims will test the US Dollar's (USD) resilience.
The US Dollar Index (DXY) trades lower near the 100.90 price zone and is set to finish the week with a 0.50% loss. The Greenback will now focus on a relatively light but important United States (US) calendar. Monday will bring the final S&P Global Services PMI and ISM Services PMI, while Tuesday’s trade balance and Wednesday’s FOMC Minutes will be key. The minutes from the Fed’s June meeting, the first under Chair Kevin Warsh, may offer clues on whether policymakers remain committed to a restrictive stance.
US Dollar Price Today
The table below shows the percentage change of US Dollar (USD) against listed major currencies today. US Dollar was the strongest against the Japanese Yen.
| USD | EUR | GBP | JPY | CAD | AUD | NZD | CHF | |
|---|---|---|---|---|---|---|---|---|
| USD | -0.04% | -0.06% | 0.16% | 0.15% | -0.17% | -0.14% | 0.04% | |
| EUR | 0.04% | -0.03% | 0.20% | 0.18% | -0.16% | -0.13% | 0.07% | |
| GBP | 0.06% | 0.03% | 0.22% | 0.20% | -0.16% | -0.09% | 0.10% | |
| JPY | -0.16% | -0.20% | -0.22% | -0.01% | -0.37% | -0.33% | -0.12% | |
| CAD | -0.15% | -0.18% | -0.20% | 0.00% | -0.37% | -0.30% | -0.10% | |
| AUD | 0.17% | 0.16% | 0.16% | 0.37% | 0.37% | 0.07% | 0.25% | |
| NZD | 0.14% | 0.13% | 0.09% | 0.33% | 0.30% | -0.07% | 0.19% | |
| CHF | -0.04% | -0.07% | -0.10% | 0.12% | 0.10% | -0.25% | -0.19% |
The heat map shows percentage changes of major currencies against each other. The base currency is picked from the left column, while the quote currency is picked from the top row. For example, if you pick the US Dollar from the left column and move along the horizontal line to the Japanese Yen, the percentage change displayed in the box will represent USD (base)/JPY (quote).
EUR/USD trades on a higher note near the 1.1440 level and will likely remain driven by the contrast between softer US labor data and the European Central Bank’s (ECB) cautious stance. Germany and France's trade and industrial data will also be watched for signs of whether the recovery in activity can continue.
GBP/USD rose sharply by more than 1% this week, trading near 1.3350 and is poised to remain sensitive to broader USD direction. If the FOMC Minutes show concern over the labor market, the pair may find support.
USD/JPY trades near the 161.40 level after hitting a 40-year high of 162.84 earlier this week. The Japanese Yen may struggle if the US Dollar keeps rising, but softer US data could limit the pair’s upside if markets price in a less restrictive path for the Fed. Intervention risks may also stay in focus if USD/JPY remains near multi-decade highs.
AUD/USD trades near the 0.6940 price zone and will watch China-related sentiment and the broader USD trend. The Aussie recently found support from stronger Australian PMIs and resilient Chinese services activity.
West Texas Intermediate (WTI) Oil trades near $68.80 per barrel. The black gold will remain sensitive to supply expectations, geopolitical risks, and the upcoming OPEC+ meeting. Recent declines in Oil prices back toward pre-war levels have reduced some inflation fears, but any change in supply guidance could quickly revive volatility across energy markets.
Gold (XAU/USD) trades higher near the $4,175 level and may continue to benefit if US yields fall and the Fed minutes strengthen expectations that the central bank may not keep policy restrictive for much longer. However, a stronger US Dollar rebound could limit upside momentum for the precious metal.
Anticipating economic perspectives: Voices on the horizon
Monday, July 6
- Fed Governor Waller
- BoE’s Mann
- ECB’s Schnabel
- ECB President Lagarde
- ECB’s Lane
Tuesday, July 7
- BoE’s Mann
Wednesday, July 8
- RBA’s Hunter
Thursday, July 9
- BoE’s Breeden
- ECB President Lagarde
- ECB’s Cipollone
Friday, July 10
- ECB President Lagarde
- ECB’s Vujčić
Central bank meetings and policy decisions
The main policy decision next week will be the RBNZ Monetary Policy Review and OCR announcement on Wednesday, July 8, with the online media conference also scheduled later that day. The FOMC Minutes from the June 17 meeting will also be released on Wednesday, while the ECB account of its June policy meeting is due on Thursday. The BoE Financial Stability Report and FPC Record will be published on Tuesday. No major interest rate decisions are scheduled from the Fed, ECB, BoE, BoJ, RBA, or BoC during the week.

UOB’s Quek Ser Leang notes that USD/CNH has seen a slight pickup in downward momentum, but still expects the pair to remain range-bound. The bank now looks for a lower intraday band around 6.7820–6.7940, while its 1–3 week view stays neutral, with USD/CNH likely to trade between 6.7750 and 6.8080.
USD/CNH seen holding defined ranges
"24-HOUR VIEW: Two days ago, USD traded within a range of 6.7911/6.8025 and closed little changed at 6.7948 (+0.05%). Yesterday, we indicated that “the price action provides no fresh clues, and we continue to expect USD to trade between 6.7860 and 6.7990.” USD then traded within a range of 6.7840/6.7963 before settling at 6.7884 (-0.09%). There has been a slight increase in downward momentum, but this is likely to lead to USD trading in a lower range of 6.7820/6.7940 rather than a sustained decline."
"1-3 WEEKS VIEW: We revised our view from positive to neutral two days ago (01 Jul, spot at 6.7920). We highlighted that the recent USD “strength has come to an end.” We also highlighted that USD “is likely to trade in a range between 6.7750 and 6.8080.” We continue to hold the same view"
(This article was created with the help of an Artificial Intelligence tool and reviewed by an editor.)

- NZD/USD remains bearish despite rebound above 0.5700 figure.
- RSI rises below 50, signaling buyers lack full control.
- Break above 0.5750 exposes 0.5800 and key SMA cluster.
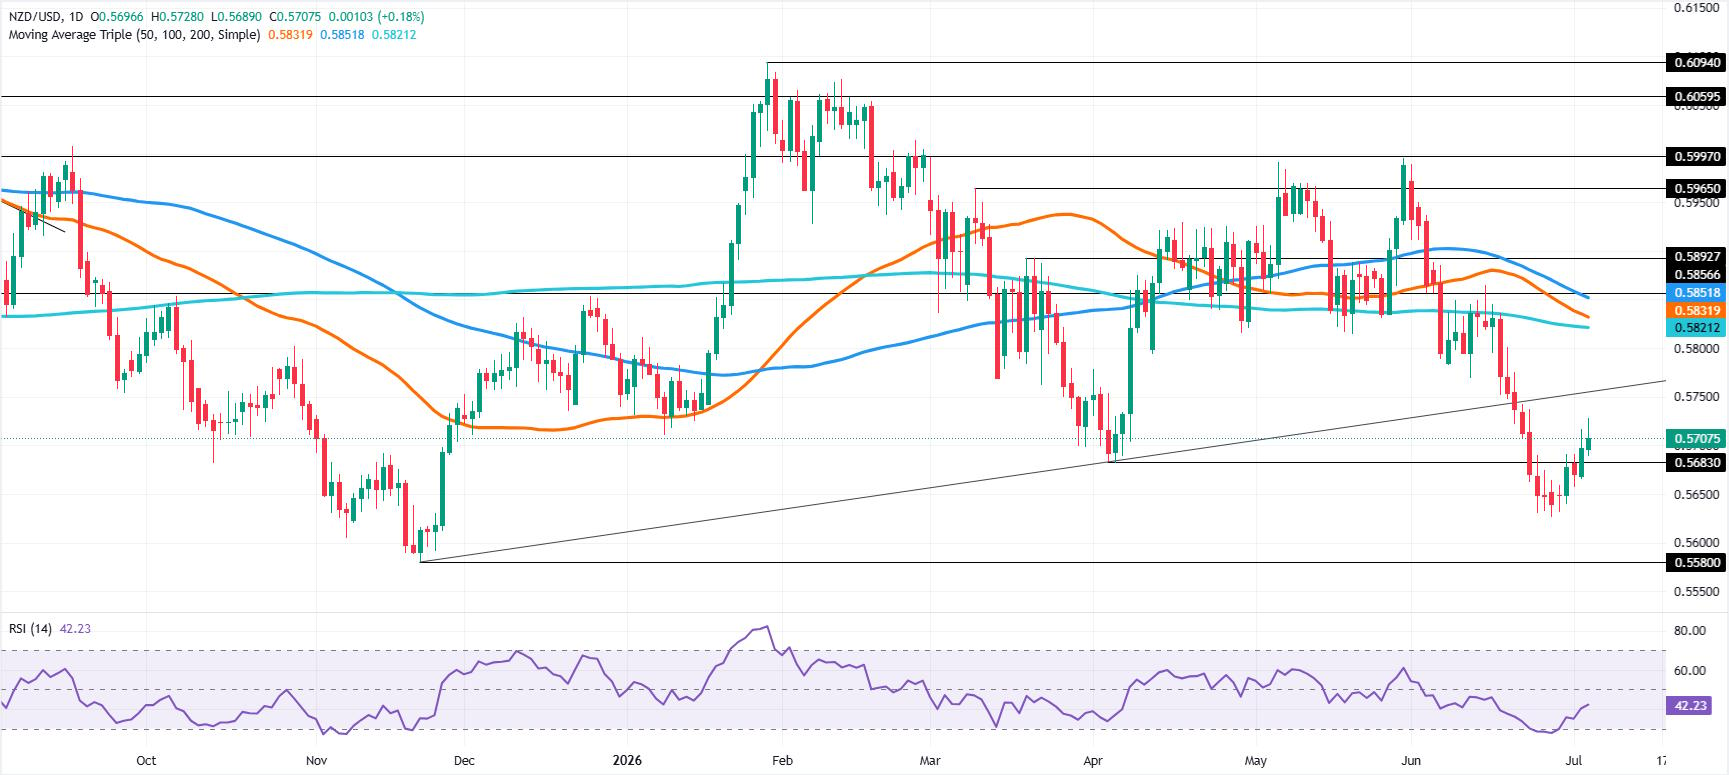
The Kiwi Dollar clears the 0.5700 figure on Friday, clings to gains of over 0.22% against the Greenback after hitting a daily low of 0.5689. At the time of writing, the NZD/USD trades at 0.5709.
NZD/USD Price Forecast: Technical outlook
The NZD/USD remains technically bearish, even though interest rate probabilities suggest the Reserve Bank of New Zealand could raise rates at least twice. However, in the short term, the leg-up would test an support-trendline-turned resistance at around 0.5750.
The Relative Strength Index (RSI) is rising, suggesting buyers are gaining traction, but it remains below the 50-neutral level. Hence, the overall trend is downwards.
For a bullish reversal, the NZD/USD must clear 0.5750, followed by the 0.5800 mark. Above this level, the next resistance is the 200-day Simple Moving Average (SMA) at 0.5821, followed by the 50-day SMA at 0.5831, and then the 100-day SMA at 0.5851. Once those levels are cleared, the next resistance is the 0.5900 milestone.
On the flipside, if NZD/USD tumbles below the current low of the day (LOD) at 0.5689, the next support is at 0.5650, followed by 0.5600.
NZD/USD Price Chart – Technical outlook
New Zealand Dollar FAQs
The New Zealand Dollar (NZD), also known as the Kiwi, is a well-known traded currency among investors. Its value is broadly determined by the health of the New Zealand economy and the country’s central bank policy. Still, there are some unique particularities that also can make NZD move. The performance of the Chinese economy tends to move the Kiwi because China is New Zealand’s biggest trading partner. Bad news for the Chinese economy likely means less New Zealand exports to the country, hitting the economy and thus its currency. Another factor moving NZD is dairy prices as the dairy industry is New Zealand’s main export. High dairy prices boost export income, contributing positively to the economy and thus to the NZD.
The Reserve Bank of New Zealand (RBNZ) aims to achieve and maintain an inflation rate between 1% and 3% over the medium term, with a focus to keep it near the 2% mid-point. To this end, the bank sets an appropriate level of interest rates. When inflation is too high, the RBNZ will increase interest rates to cool the economy, but the move will also make bond yields higher, increasing investors’ appeal to invest in the country and thus boosting NZD. On the contrary, lower interest rates tend to weaken NZD. The so-called rate differential, or how rates in New Zealand are or are expected to be compared to the ones set by the US Federal Reserve, can also play a key role in moving the NZD/USD pair.
Macroeconomic data releases in New Zealand are key to assess the state of the economy and can impact the New Zealand Dollar’s (NZD) valuation. A strong economy, based on high economic growth, low unemployment and high confidence is good for NZD. High economic growth attracts foreign investment and may encourage the Reserve Bank of New Zealand to increase interest rates, if this economic strength comes together with elevated inflation. Conversely, if economic data is weak, NZD is likely to depreciate.
The New Zealand Dollar (NZD) tends to strengthen during risk-on periods, or when investors perceive that broader market risks are low and are optimistic about growth. This tends to lead to a more favorable outlook for commodities and so-called ‘commodity currencies’ such as the Kiwi. Conversely, NZD tends to weaken at times of market turbulence or economic uncertainty as investors tend to sell higher-risk assets and flee to the more-stable safe havens.

Commerzbank highlights that strong Singapore manufacturing and electronics PMIs underpin a constructive growth outlook, with Q2 GDP expected to exceed Q1’s 6% expansion. Against this backdrop, USD/SGD has eased slightly but remains near this year’s highs. The bank expects the pair to consolidate in a defined range rather than trend strongly in the near term.
Range-bound outlook for USD/SGD
"Looking ahead, the manufacturing outlook remains constructive."
"We will get the advance Q2 GDP report in the next week or so."
"It is expected to post a strong performance and even exceed Q1’s 6% yoy expansion, supported by a strong manufacturing sector and continued firm domestic demand."
"Growth this year is likely to exceed the upper end of the government's 2-4% forecast, and the official forecast may be revised up when the final Q2 report is released around August."
"For USD/SGD, it was slightly lower yesterday by around 30 pips to 1.2930. It is holding around this year's high, and we look for consolidation in the near term between 1.28 and 1.30."
(This article was created with the help of an Artificial Intelligence tool and reviewed by an editor.)

Societe Generale notes that stronger-than-expected China PMI data suggest slow but steady growth, reducing urgency for the PBoC to ease policy. The bank highlights that USD/CNY has fallen back below its 50-day moving average as Yuan strength reflects robust exports supported by the global AI boom. The report also points to a higher trade-weighted CEFTS RMB Index and firmer 10y CGB yields.
Yuan strength backed by exports
"China PMI signals slow growth but less urgency for the PBoC to ease: official manufacturing PMI rose more than expected to 50.3 in June from 50.0 while non-manufacturing PMI surprisingly rose to 50.2 from 50.1."
"The yuan bulls are firmly in control with USD/CNY back below 6.7938 (50dma) following US NFP miss yesterday. The private RatingDog manufacturing PMI expanded for a seventh straight month in June."
"The yuan's rise in 1H26 reflects robust exports that was partly powered by the global AI boom. EU's trade chief Maros Sefcovic and China's commerce minister Wang Wentao held discussions in Brussels aimed at resolving trade issues. The trade-weighted CEFTS RMB Index climbed to the highest level since July 2022."
"Domestically the spotlight will shift to the Politburo meeting later this month. The NDRC has tightened oversight of fundraising, urging banks to avoid underwriting high-yield yuan and USD bonds. "
"The goal is to cut down on higher cost borrowing and excessive debt financing, particularly among the local government financial vehicles. The 10y CGB yield rose 3bp this week to 1.75%."
(This article was created with the help of an Artificial Intelligence tool and reviewed by an editor.)

- USD/JPY trims losses on Friday after hitting a two-week low.
- The Greenback regained some demand as investors reassessed the impact of Thursday’s weak US labor data and adjusted positions after the initial selloff.
- The Yen found limited support from Japan’s stronger Services PMI, which rose to 52.2 in June.
The USD/JPY pair posts modest gains on Friday amid thin trading due to the US Independence Day holiday. The US Dollar (USD) stabilizes against the Japanese Yen (JPY) after a sharp decline on Thursday following softer-than-expected United States (US) labor market data. At the time of writing, USD/JPY trades at 161.30 after falling to a two-week low of 160.49 earlier in the Asian session.
The Greenback weakened on Thursday after the latest US Nonfarm Payrolls report missed expectations, signaling that the labor market is cooling. Softer job creation reinforced expectations that the Federal Reserve (Fed) may have less room to keep interest rates restrictive for longer, weighing on US Treasury yields. However, the US Dollar later bounced back as traders adjusted positions after the initial selloff, helping USD/JPY regain traction.
Short-term technical analysis:
On the 4-hour chart, USD/JPY trades at 161.29. The pair hovers around the 100-period Simple Moving Average (SMA) at 161.29, leaving the near-term bias neutral as price consolidates between nearby levels. The 20-period SMA at 161.91 stands above current price and acts as dynamic resistance, suggesting upside attempts remain capped for now, while the Relative Strength Index (RSI) easing toward the mid-40s hints at fading bullish momentum rather than outright oversold conditions.
On the topside, immediate resistance appears at the horizontal barrier near 161.39, ahead of the 20-period SMA cluster around 161.91. On the downside, first support is seen at 161.12, with additional cushions at 160.90 and 160.79, where prior horizontal floors and the broader trend base converge, and a sustained break below these levels would tilt the bias more decisively in favor of sellers.
(The technical analysis of this story was written with the help of an AI tool.)

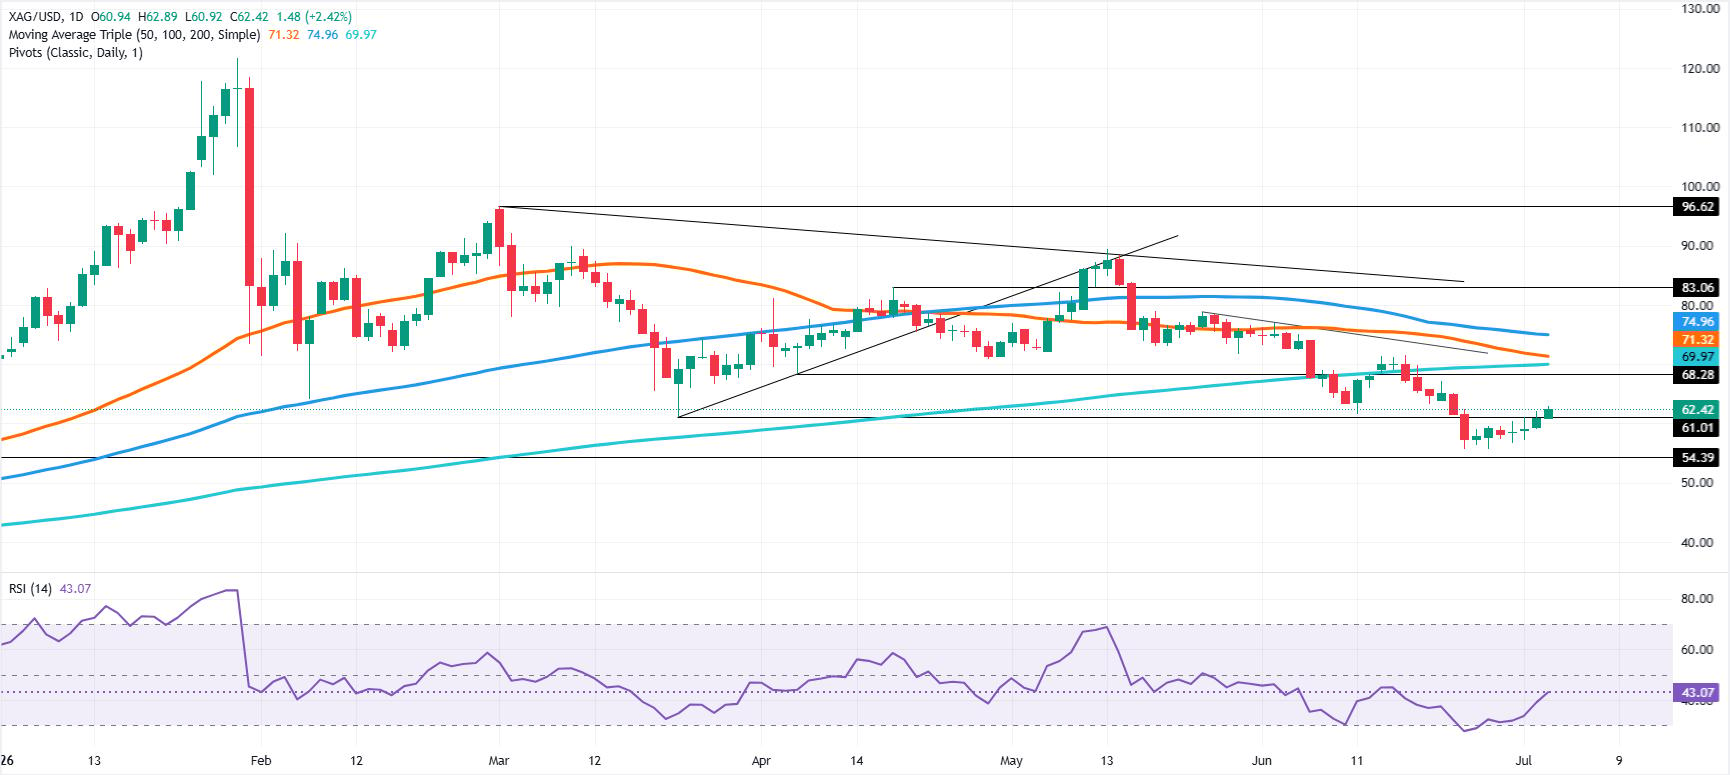
- Silver rebounds from oversold conditions, extending weekly gains above $60.
- RSI climbs toward 50, signaling buyers are regaining traction.
- Break above $65 exposes 200-day SMA and $71.32 resistance.
Silver (XAG/USD) prices reclaim the $60.00 mark for the second straight day on Friday, extending their weekly gains to over 5.50% and trading at $62.42 amid broader US Dollar weakness, pushing the white metal to an eight-day high of $62.89.
XAG/USD Price Forecast: Terminal outlook
Silver’s rebound will face stiff resistance once it approaches the 200-day Simple Moving Average (SMA), which looms below the $70.00 figure at $69.97.
Momentum is still bearish even though buyers are gaining momentum. The Relative Strength Index (RSI) exited oversold territory, bouncing towards the 43 marks, poised to turn bullish.
If XAG/USD clears the $65.00 mark, this clears the way towards the 200-day SMA. If taken out, the next resistance would be the 50-day SMA at $71.32, followed by the 100-day SMA at $74.96.
Conversely, for the downtrend to continue, Silver must clear the day's low at $60.92. Once hurdled, the next support would be the $60.00 milestone, followed by the June 30 swing low of $56.61.
XAG/USD Price Chart – Daily
Silver FAQs
Silver is a precious metal highly traded among investors. It has been historically used as a store of value and a medium of exchange. Although less popular than Gold, traders may turn to Silver to diversify their investment portfolio, for its intrinsic value or as a potential hedge during high-inflation periods. Investors can buy physical Silver, in coins or in bars, or trade it through vehicles such as Exchange Traded Funds, which track its price on international markets.
Silver prices can move due to a wide range of factors. Geopolitical instability or fears of a deep recession can make Silver price escalate due to its safe-haven status, although to a lesser extent than Gold's. As a yieldless asset, Silver tends to rise with lower interest rates. Its moves also depend on how the US Dollar (USD) behaves as the asset is priced in dollars (XAG/USD). A strong Dollar tends to keep the price of Silver at bay, whereas a weaker Dollar is likely to propel prices up. Other factors such as investment demand, mining supply – Silver is much more abundant than Gold – and recycling rates can also affect prices.
Silver is widely used in industry, particularly in sectors such as electronics or solar energy, as it has one of the highest electric conductivity of all metals – more than Copper and Gold. A surge in demand can increase prices, while a decline tends to lower them. Dynamics in the US, Chinese and Indian economies can also contribute to price swings: for the US and particularly China, their big industrial sectors use Silver in various processes; in India, consumers’ demand for the precious metal for jewellery also plays a key role in setting prices.
Silver prices tend to follow Gold's moves. When Gold prices rise, Silver typically follows suit, as their status as safe-haven assets is similar. The Gold/Silver ratio, which shows the number of ounces of Silver needed to equal the value of one ounce of Gold, may help to determine the relative valuation between both metals. Some investors may consider a high ratio as an indicator that Silver is undervalued, or Gold is overvalued. On the contrary, a low ratio might suggest that Gold is undervalued relative to Silver.
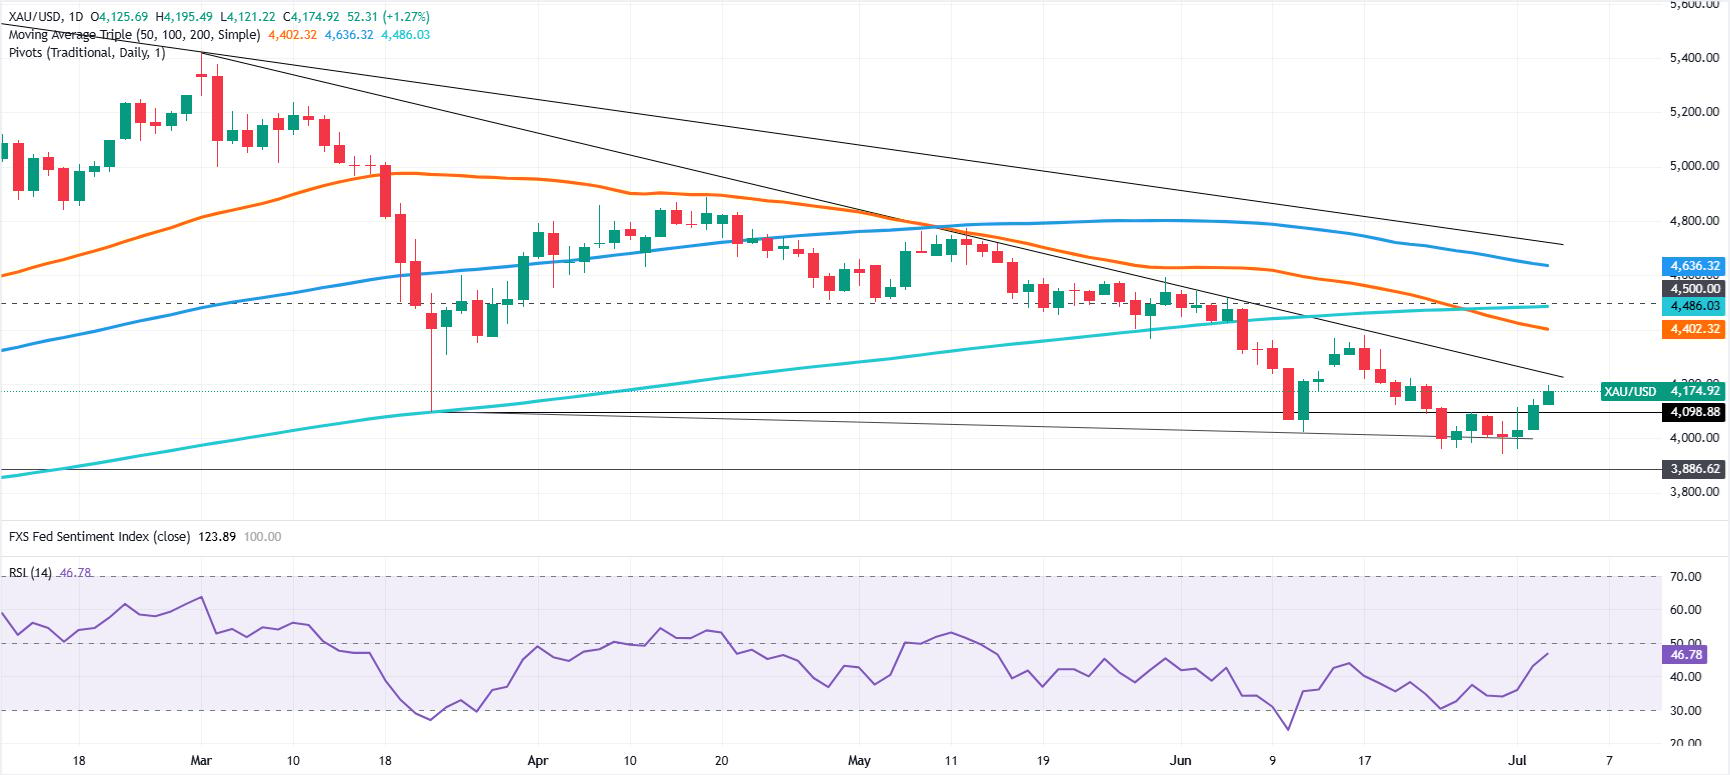
- Gold waits for the next catalyst, with FOMC minutes and US CPI up next.
- Weak NFP print trims expectations for year-end Fed tightening.
- US Dollar heads for a weekly loss after payrolls miss forecasts.
Gold (XAU/USD) price rises by more than 1% on Friday as investors digest a softer-than-expected US jobs report, trimming hawkish bets despite higher inflation. At the time of writing, the XAU/USD pair trades at $4,174, after bouncing off daily lows of $4,121.
Bullion rises as soft jobs data weighs on Dollar outlook
On Thursday, US Nonfarm Payrolls for June missed estimates by a large margin, coming in at 57K instead of 110 K. The Unemployment Rate edged lower, but mostly due to a lower participation rate, which hit 61.5, the lowest since March 2021.
Immediately, the swaps market adjusted interest rate expectations of the Federal Reserve (Fed), with investors now expecting a slim 46% chance of a rate increase toward the end of the year.
Consequently, the Greenback tanked, as depicted by the US Dollar Index (DXY), that is set to end the week with a 0.52% loss. The DXY, which measures the buck’s performance against six currencies, is flat at 100.83.
At the same time, the US 10-year Treasury yield is steady at 4.485%, increasing the appeal of the non-yielding metal, which fares well amid lower interest rate scenarios.
The new Fed Chair, Kevin Warsh, did not give forward guidance but reaffirmed the Fed’s dedication to controlling inflation.
Over the next week, traders will closely analyse the FOMC minutes, especially as they await the US inflation report on July 14. Further data is expected, including the release of the ISM Services PMI and Initial Jobless Claims for the week ending July 4, which are expected to rise from 215K to 219K.
Meanwhile, the World Gold Council said that central banks were back in buying mode in May, and, based on the latest reported data, official Gold reserves increased by a net 41 tons.
XAU/USD technical outlook: Gold reclaims $4,100 but remains bearish below the 200-SMA
Despite rising for the third straight day, Gold remains downwardly biased. Momentum shifted slightly bullish, short-term, according to the Relative Strength Index (RSI).
On the upside, Gold is poised to challenge the psychological $4,200 figure. Above this area, the next resistance is a downslope resistance trendline at around $4,225-$4,250, followed by the $4,300 mark. Overhead lies the 200-day Simple Moving Average (SMA) at $4,402.
For a bearish continuation, XAU/USD sellers need to drive spot prices below $4,100 ahead of testing the $4,050 and $4,000 psychological levels. A breach of the latter will expose the yearly low of $3,941, ahead of $3,900.
Gold FAQs
Gold has played a key role in human’s history as it has been widely used as a store of value and medium of exchange. Currently, apart from its shine and usage for jewelry, the precious metal is widely seen as a safe-haven asset, meaning that it is considered a good investment during turbulent times. Gold is also widely seen as a hedge against inflation and against depreciating currencies as it doesn’t rely on any specific issuer or government.
Central banks are the biggest Gold holders. In their aim to support their currencies in turbulent times, central banks tend to diversify their reserves and buy Gold to improve the perceived strength of the economy and the currency. High Gold reserves can be a source of trust for a country’s solvency. Central banks added 1,136 tonnes of Gold worth around $70 billion to their reserves in 2022, according to data from the World Gold Council. This is the highest yearly purchase since records began. Central banks from emerging economies such as China, India and Turkey are quickly increasing their Gold reserves.
Gold has an inverse correlation with the US Dollar and US Treasuries, which are both major reserve and safe-haven assets. When the Dollar depreciates, Gold tends to rise, enabling investors and central banks to diversify their assets in turbulent times. Gold is also inversely correlated with risk assets. A rally in the stock market tends to weaken Gold price, while sell-offs in riskier markets tend to favor the precious metal.
The price can move due to a wide range of factors. Geopolitical instability or fears of a deep recession can quickly make Gold price escalate due to its safe-haven status. As a yield-less asset, Gold tends to rise with lower interest rates, while higher cost of money usually weighs down on the yellow metal. Still, most moves depend on how the US Dollar (USD) behaves as the asset is priced in dollars (XAU/USD). A strong Dollar tends to keep the price of Gold controlled, whereas a weaker Dollar is likely to push Gold prices up.

ABN AMRO’s Bill Diviney expects the US Dollar to weaken broadly but notes slightly less upside for EUR/USD after revising the bank’s ECB outlook and incorporating French and US election risks. With the ECB seen delivering one more hike and the Fed staying more dovish than markets, ABN AMRO now projects EUR/USD at 1.18 for 2026 and 1.23 for 2027.
Euro gains tempered by election risks
"We still expect the US dollar to weaken more broadly."
"However, we have made a modest adjustment to our EUR/USD forecasts because of two developments."
"Taken together, these factors point to slightly less upside for EUR/USD this year and next year."
"Our new year-end forecast is 1.18 for 2026 and 1.23 for 2027."
(This article was created with the help of an Artificial Intelligence tool and reviewed by an editor.)

- USD/CHF rebounds on Friday but remains on track for its first weekly loss in five weeks.
- Weak US NFP data delays expectations of Fed rate hikes, weighing on the US Dollar.
- Markets shift focus to next week's US ISM Services PMI and Fed meeting minutes.
USD/CHF heads for its first weekly loss in five weeks as weaker-than-expected US Nonfarm Payrolls (NFP) data released on Thursday weighed on the US Dollar (USD). The pair rebounds on Friday as the Greenback stabilizes, with traders reassessing the Federal Reserve's (Fed) interest rate outlook.
At the time of writing, USD/CHF is trading virtually unchanged around 0.8034 after touching an intraday low of 0.8010. The US Dollar Index (DXY), which tracks the Greenback's value against a basket of six major currencies, is trading around 100.84, recovering from an intraday low of 100.61.
The lack of follow-through selling in the US Dollar (USD) after the weak NFP print suggests the data merely delayed expectations of Federal Reserve (Fed) interest rate hikes.
Traders continue to expect monetary policy to remain restrictive as inflation remains above the central bank's 2% target after accelerating in recent months, driven by higher Oil prices.
According to the CME FedWatch Tool, traders are pricing in a 53% probability of a rate hike at the September meeting, down from 63% before the NFP release, while the probability of a December rate hike remains elevated at 76%.
However, the June Consumer Price Index (CPI) report due later this month is likely to provide greater clarity on the Fed's interest rate path, with energy-driven inflation risks easing as Oil prices have retraced most of the gains triggered by the US-Iran war.
In the meantime, the US Dollar's pullback may remain shallow, limiting stronger gains in the Swiss Franc (CHF).
On the Swiss side, the low-inflation backdrop supports the view that the Swiss National Bank (SNB) will maintain its current policy stance, keeping interest rates at 0%. Meanwhile, the central bank continues to warn against excessive strength in the Swiss Franc and remains ready to intervene in the foreign exchange market if necessary.
Looking ahead to next week, traders will focus on the US ISM Services Purchasing Managers Index (PMI) data, followed by the minutes of the Fed's latest policy meeting. The Swiss economic calendar remains empty.
Inflation FAQs
Inflation measures the rise in the price of a representative basket of goods and services. Headline inflation is usually expressed as a percentage change on a month-on-month (MoM) and year-on-year (YoY) basis. Core inflation excludes more volatile elements such as food and fuel which can fluctuate because of geopolitical and seasonal factors. Core inflation is the figure economists focus on and is the level targeted by central banks, which are mandated to keep inflation at a manageable level, usually around 2%.
The Consumer Price Index (CPI) measures the change in prices of a basket of goods and services over a period of time. It is usually expressed as a percentage change on a month-on-month (MoM) and year-on-year (YoY) basis. Core CPI is the figure targeted by central banks as it excludes volatile food and fuel inputs. When Core CPI rises above 2% it usually results in higher interest rates and vice versa when it falls below 2%. Since higher interest rates are positive for a currency, higher inflation usually results in a stronger currency. The opposite is true when inflation falls.
Although it may seem counter-intuitive, high inflation in a country pushes up the value of its currency and vice versa for lower inflation. This is because the central bank will normally raise interest rates to combat the higher inflation, which attract more global capital inflows from investors looking for a lucrative place to park their money.
Formerly, Gold was the asset investors turned to in times of high inflation because it preserved its value, and whilst investors will often still buy Gold for its safe-haven properties in times of extreme market turmoil, this is not the case most of the time. This is because when inflation is high, central banks will put up interest rates to combat it. Higher interest rates are negative for Gold because they increase the opportunity-cost of holding Gold vis-a-vis an interest-bearing asset or placing the money in a cash deposit account. On the flipside, lower inflation tends to be positive for Gold as it brings interest rates down, making the bright metal a more viable investment alternative.

